Subscribe to our ▶️ YouTube channel 🔴 for the latest videos, updates, and tips.
In worksheet on bar graph we will practice different
questions on representing the bar graph from the following data given in the
questions.
1.
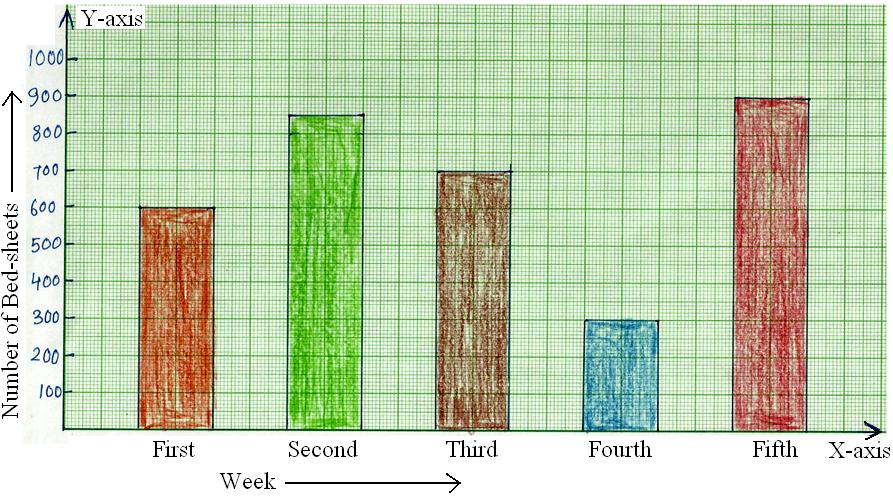
The number of bed-sheets manufactured by a factory during five consecutive
weeks is given below.
| Week | First | Second | Third | Fourth | Fifth |
| Number of Bed-sheets | 600 | 850 | 700 | 300 | 900 |
Draw the bar graph representing the above data.
2.
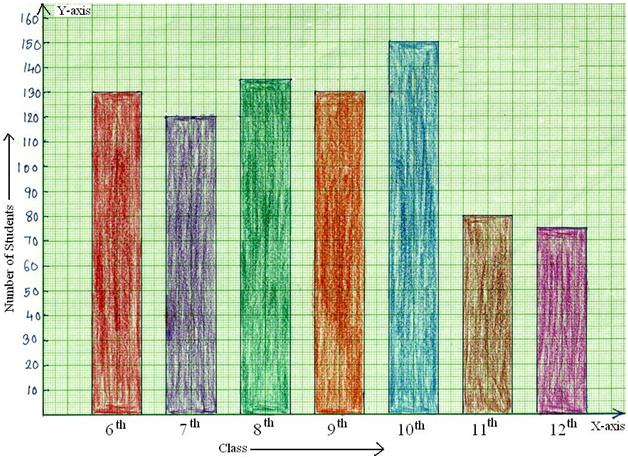
The number of students in 7 different classes is given below. Represent this
data on the bar graph.
| Class | 6th | 7th | 8th | 9th | 10th | 11th | 12th |
| Number of Students | 130 | 120 | 135 | 130 | 150 | 80 | 75 |
3.
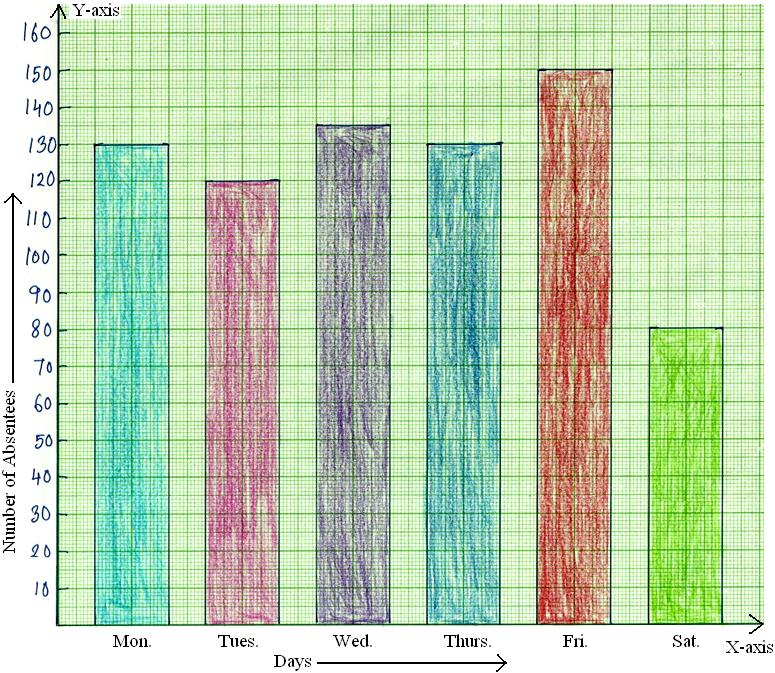
The number of absentees in class VIII was recorded in a particular week.
Represent this data on the bar graph
| Days | Mon. | Tues. | Wed. | Thurs. | Fri. | Sat. |
| Number of Absentees | 130 | 120 | 135 | 130 | 150 | 80 |
(a) On which day the maximum and minimum students were
absent?
(b) How many students were absent on Wednesday and Friday?
(c) On which days the same number of students was absent?
4.
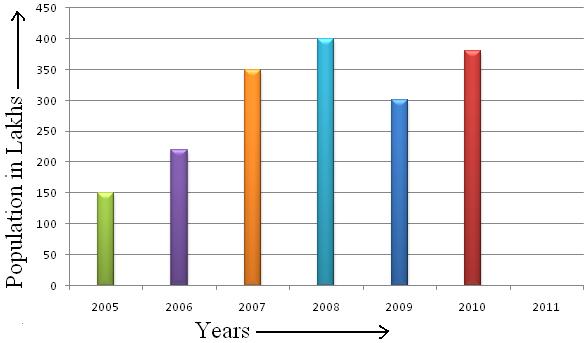
The number of trees planted by Eco-club of a school in different years is given
below.
| Year | 2005 | 2006 | 2007 | 2008 | 2009 | 2010 |
| Number of Trees to be Planted | 150 | 220 | 350 | 400 | 300 | 380 |
Draw the bar graph to represent the data.
5. The population of a
particular state in different years is given below.
| Year | 2005 | 2006 | 2007 | 2008 | 2009 | 2010 |
| Population in Lakhs | 35 | 40 | 50 | 65 | 90 | 105 |
Represent the above data using the bar graph.
6.
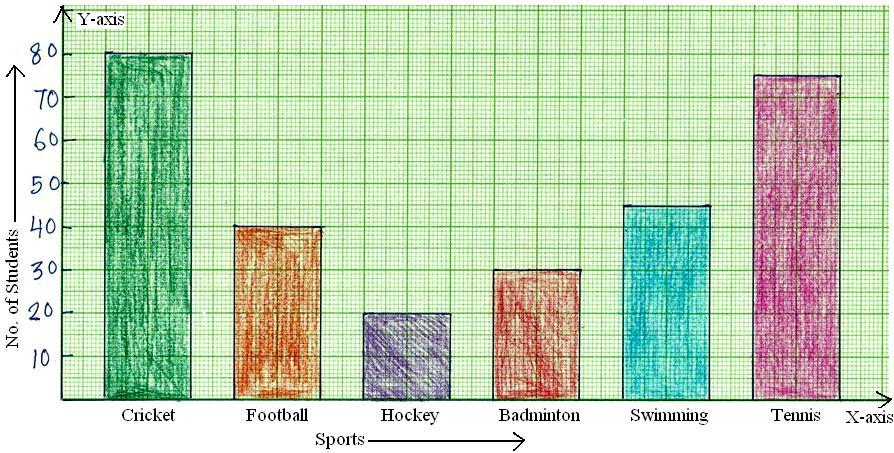
The following table shows the favorite sports of 300 students of a school.
| Sports | Cricket | Football | Hockey | Badminton | Swimming | Tennis |
| No. of Students | 80 | 40 | 20 | 30 | 45 | 75 |
Represent the above data using column graph.
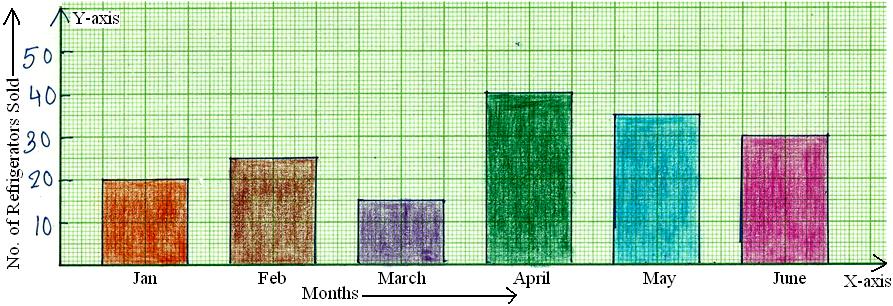
7. The following
data represents the sale of refrigerator sets in a showroom in first 6 months
of the year.
| Months | Jan | Feb | March | April | May | June |
| No. of Refrigerators Sold | 20 | 25 | 15 | 40 | 35 | 30 |
Draw the bar graph for the data given and find out the
months in which the sale was minimum and maximum.
8.
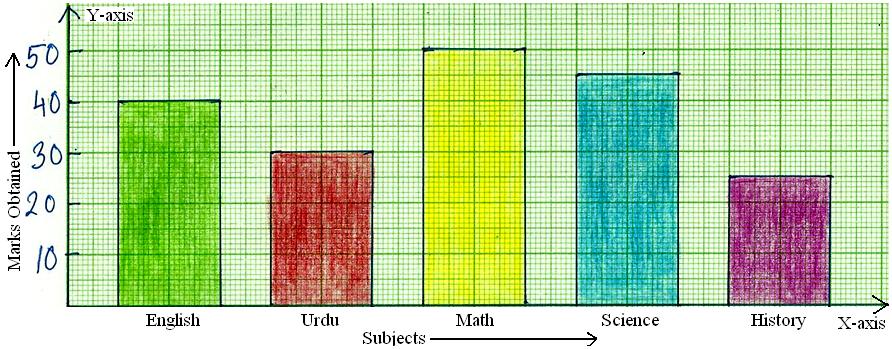
The following are the marks scored by Aaron out of 50 in different subjects in
an exam. Represent this information on a bar graph
| Subjects | English | Urdu | Math | Science | History |
| Marks Obtained | 40 | 30 | 50 | 45 | 25 |
Represent this information on a bar graph.
9.
The average monthly attendance of a class is given.
| Month | July | Aug | Sep | Oct | Nov | Dec | Jan | Feb |
| Attendance | 42 | 46 | 30 | 50 | 38 | 20 | 36 | 32 |
Draw the bar graph of the data given.
In which month the average attendance is minimum or maximum?
In which month the average attendance was less than 40?
Find the difference between the maximum and minimum average
attendance?
10.
The following data shows the birth rate per thousand of different countries
during a certain year. Draw a bar graph.
| Country | India | Pakistan | China | Sri Lanka | Russia |
| Birth Rate | 24 | 26 | 30 | 20 | 18 |
11. The weekly sale of pencil boxes in a stationary shop is given in the table below. Using a suitable scale, represent the given information on a bar graph.
(i) Write the title of the bar graph.
(ii) On which day were the maximum pencil boxes sold?
(iii) If the shopkeeper decides to close his shop for one more day each week, selection of which days would lead to minimum loss of sale and maximum loss of sale?
(iv) On which day were the least number of pencil boxes sold?
(v) Which two days were equal number of pencil boxes sold?
12. Given below is the data showing the number of students of class four whose birthday falls in first five months of the year. Make a bar graph for the given data.
13. A survey of 36 students of a class was done to find out the mode of transport used by them while commuting to the school. The collected data is shown in the table given below. Represent the data in the form of a bar graph.
|
Mode of Transport Cycle School Bus Walking Car |
Number of Students 6 16 10 4 |
Now answer the given questions.
(i) Give a suitable title for the graph.
(ii) How many students walk to school?
(iii) Which mode of transport is used by most of the students?
(iv) How many students do not travel by school bus?
14. The following table shows the number of TV sets produced by a company in 7 days of a week.

Construct a horizontal bar graph.
Study the constructed bar graph carefully and answer the following.
(i) On which day the production was maximum?
(ii) On which day the production was minimum?
(iii) On which day the production was equal in number?
(iv) On which day the production was more than 200 but less than 300?
15. The following table shows the number of cricket bats manufactured by a company in the first six months.
|
Months |
Jan. |
Feb. |
Mar. |
April. |
May. |
June. |
|
Number of cricket bats produced |
2500 |
1800 |
2400 |
2800 |
3500 |
3600 |
Construct a vertical bar graph representing the above information. Study the bar graph and tell which was the most productive month and which was the least productive?
16. The population of five major cities of India in 1971 was as follows.
|
City Bangalore Bombay Calcutta Delhi Madras |
Population (in lakhs) 29 82 92 57 43 |
Represent the above information with the help of a vertical bar graph. Study the bar graph and name the cities having the largest population and the least population?
17. The given data show the favourite fruits of 200 students in a school.
|
Fruits |
Orange |
Apple |
Mango |
Pineapple |
Grapes |
Banana |
|
Number of students |
25 |
35 |
30 |
50 |
40 |
20 |
Represent the above information by a horizontal bar graph. Which fruit is the favourite fruit of the maximum number of students and which fruit is favourite fruit of the minimum number of students?
18. The following data give the number (in hundreds) of applicants registered with an Employment Exchange during 1995-99.
|
Years |
1995 |
1996 |
1997 |
1998 |
1999 |
|
Number of applicants registered |
13 |
17 |
19 |
23 |
28 |
Construct a bar graph to represent the above data. Study the bar graph and explain the trend in the registration of candidates with the Employment Exchange. In which year was the number of applicants registered maximum and which year was minimum?
19. The year wise production of wheat is as follows. The figures are in metric tons.
|
Years |
1991 |
1992 |
1993 |
1994 |
1995 |
1996 |
|
Production |
22 |
24 |
32 |
20 |
35 |
42 |
Construct a bar graph to represent the above data. Interpret the bar graph and answer the following.
(i) What trend do you observe about increase in production of wheat?
(ii) Which was the most productive year?
(iii) Which was the least productive year?
(iv) In which year did the production of wheat fall down?
20. Read the bar graph and answer the following.
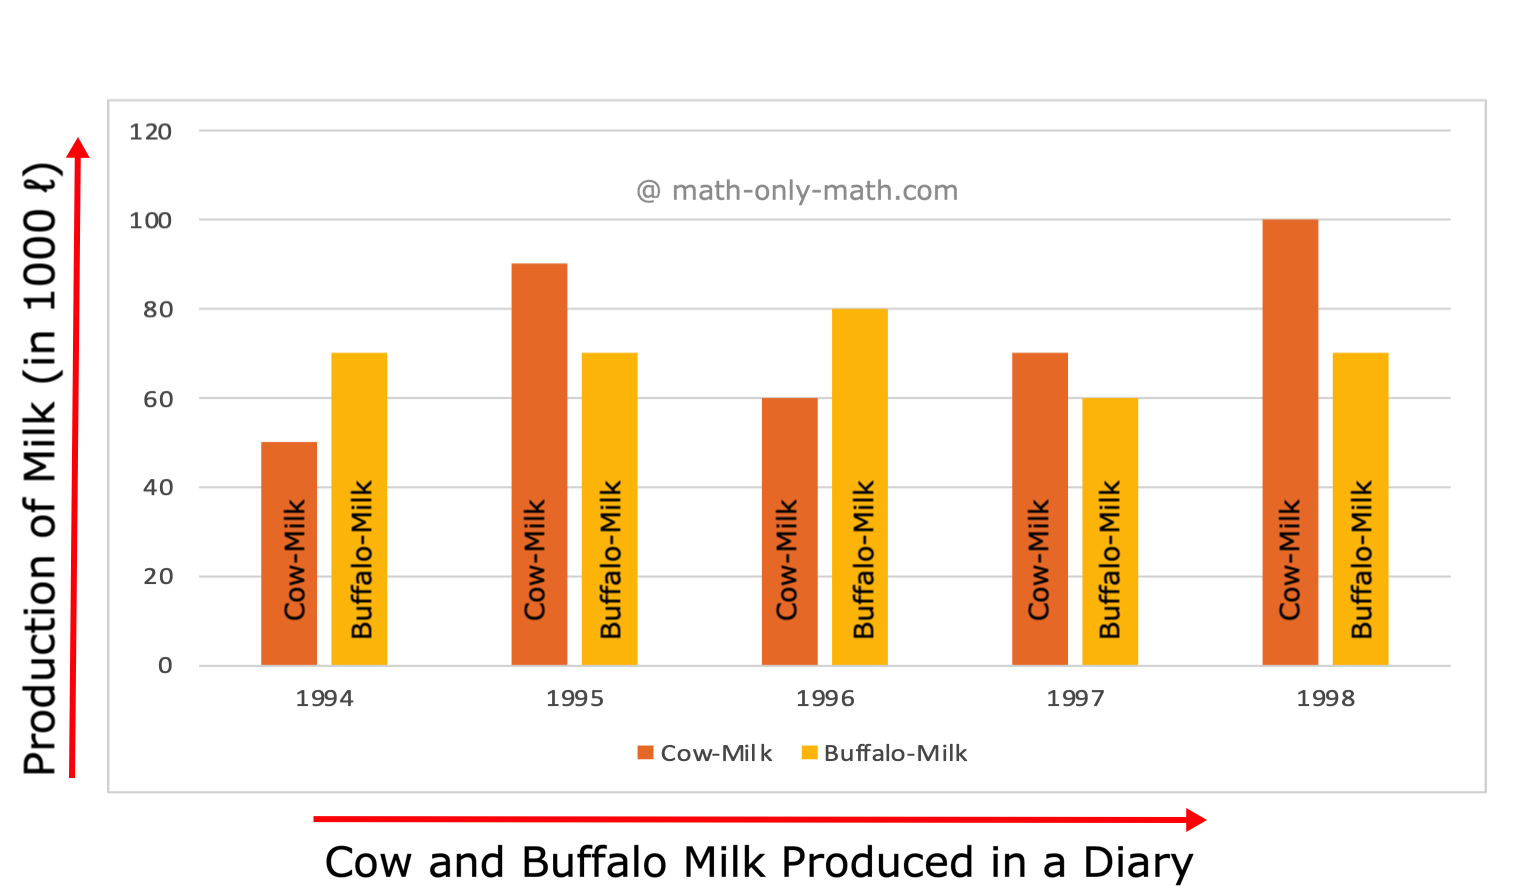
(i) In which years was the cow milk produced, more than buffalo milk?
(ii) In which years was the quantity of buffalo milk produced, the same?
(iii) In which year was the buffalo milk produced, maximum?
(iv) In which year was the buffalo milk produced, minimum?
Bar Graph Worksheet PDF Questions and Answers:
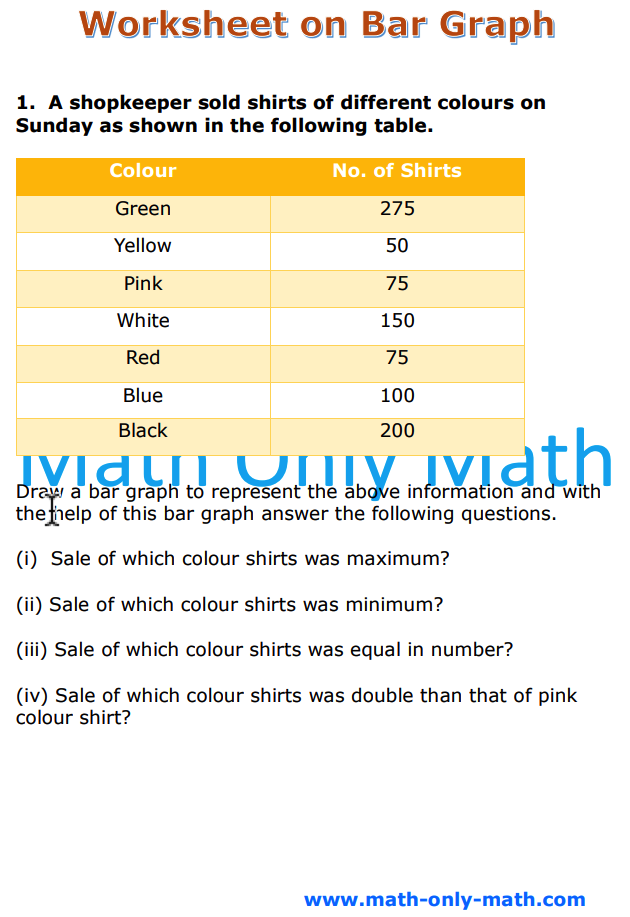 |
|
Read the questions carefully given in the worksheet on bar graph and represent the data in the column graph. The graph are shown below to check the exact bar graph.
Answers:
1.
2.
3.
4.
5.

6.
7.
8.
9.

10.

11.
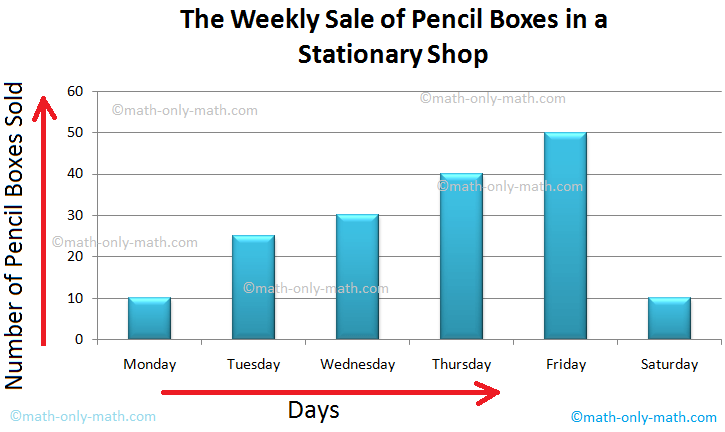
(i) The Weekly Sale of Pencil Boxes in a Stationary Shop
(ii) Friday
(iii) Saturday, Friday
(iv) Monday, Saturday
(v) Monday, Saturday
12.
13.
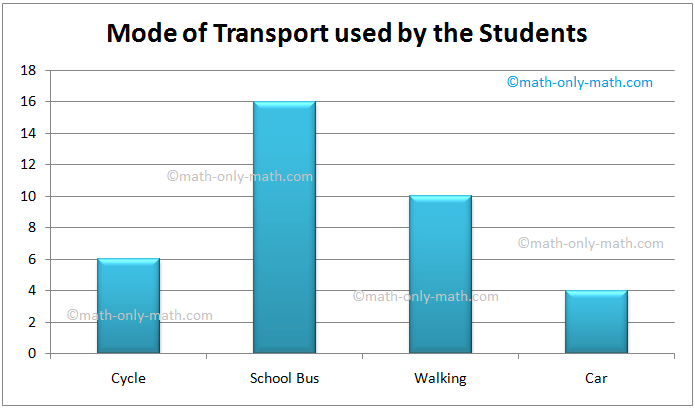
(i) Mode of Transport used by the
Students
(ii) 10
(iii) School Bus
(iv) 20
14.

(i) Monady
(ii) Wednesday
(iii) Tuesday and Saturday
(iv) Thursday
15.
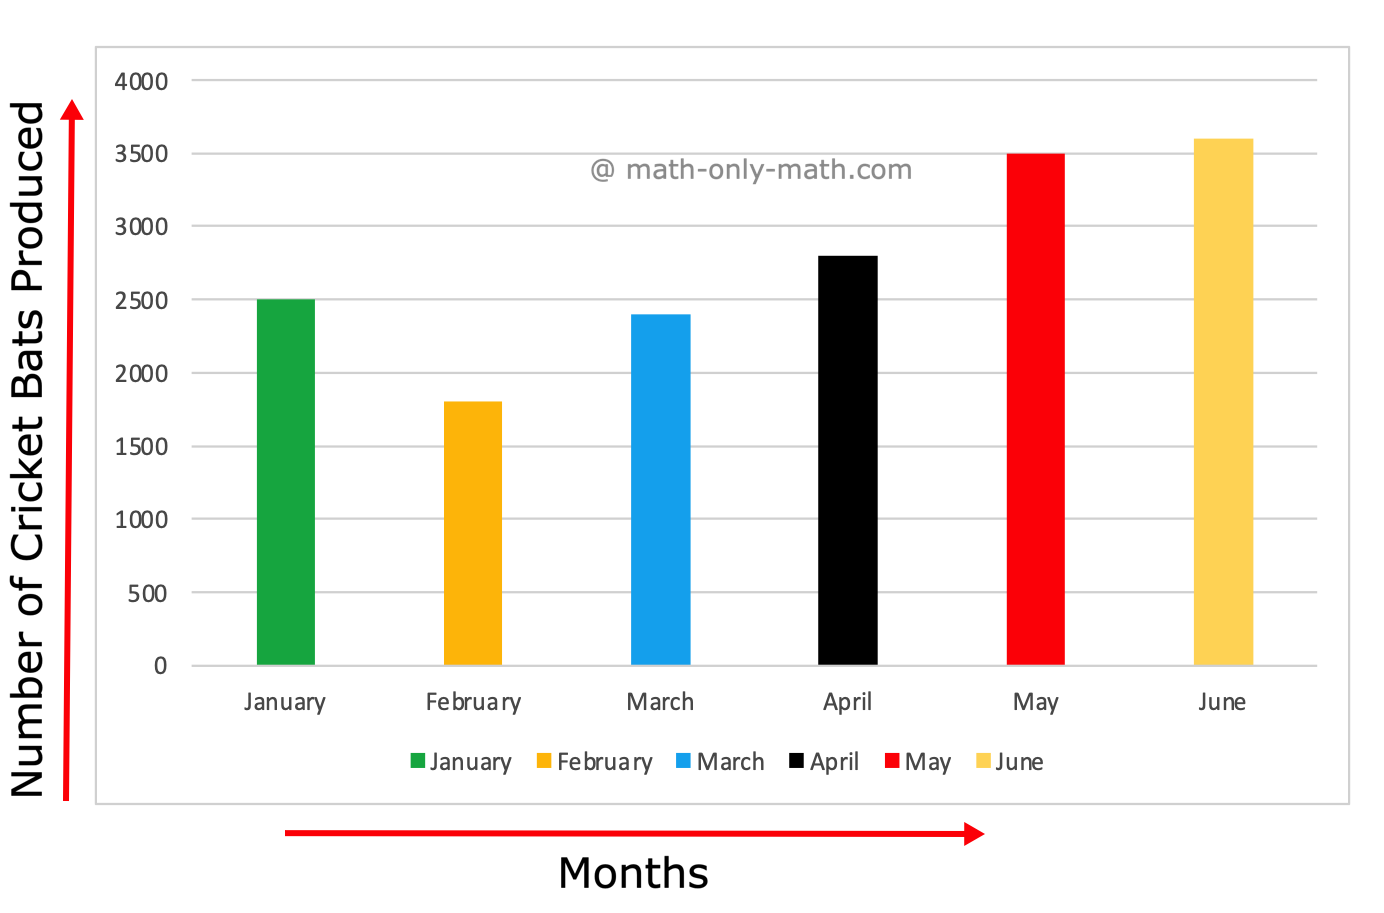
Most productive month is June and least productive month February.
16.
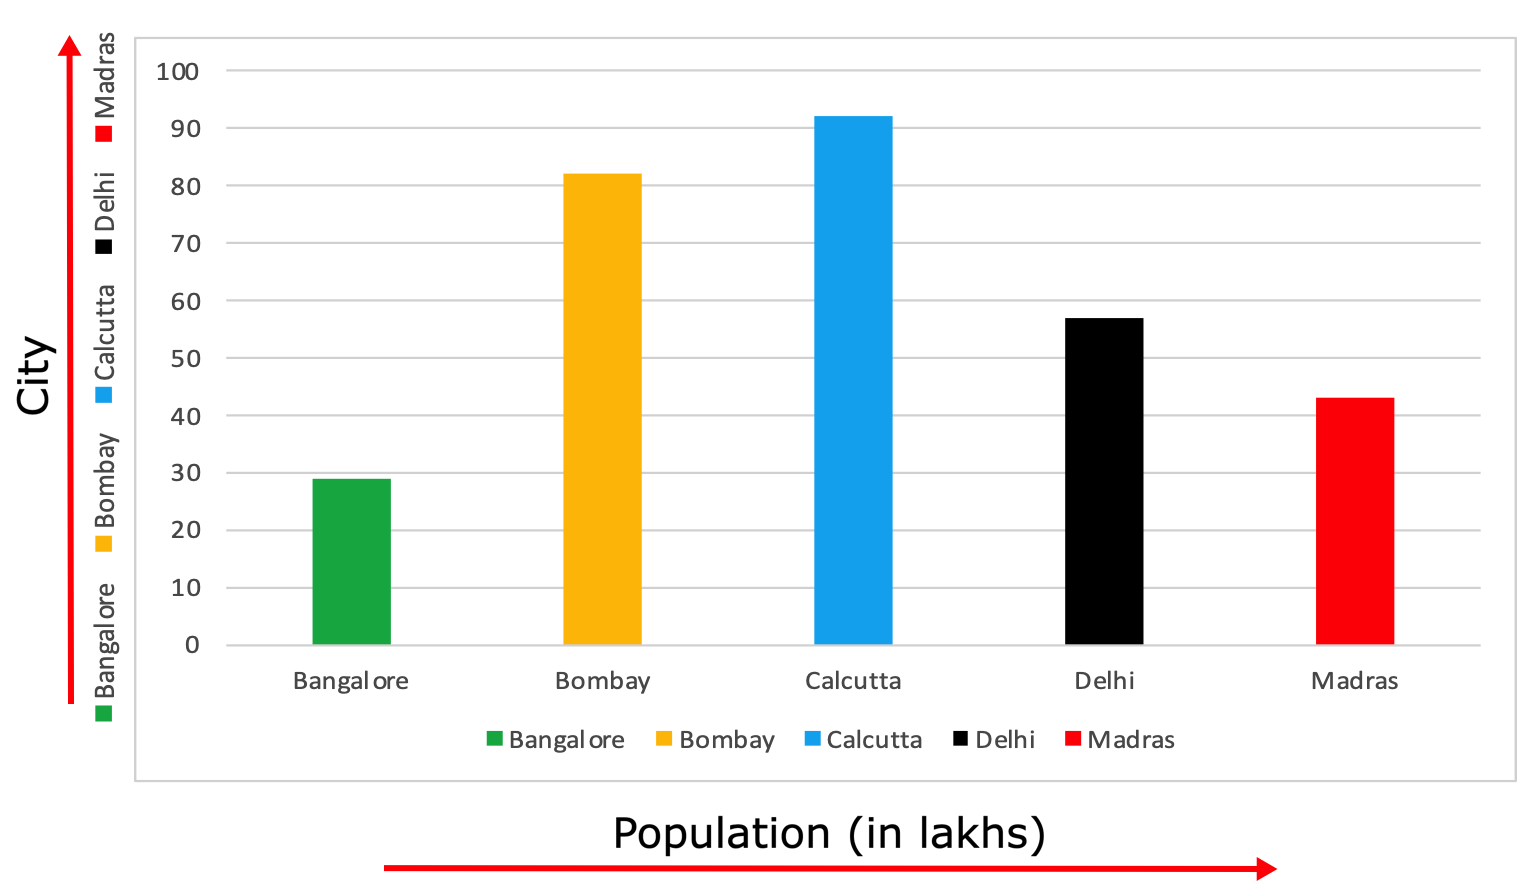
Largest population in Calcutta and least population in Bangalore.
17.
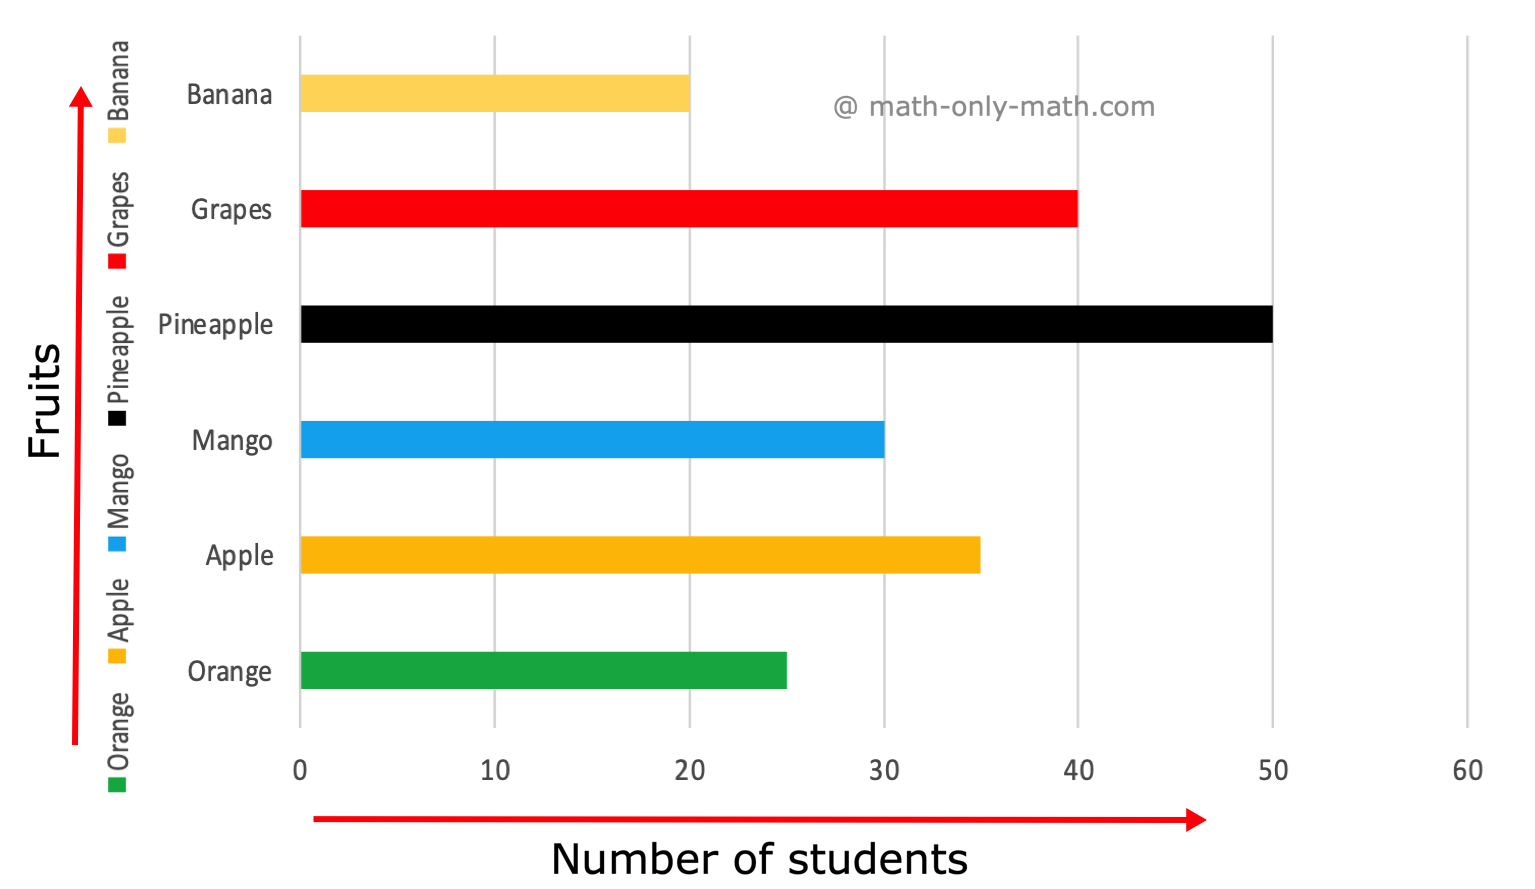
Maximum number Pineapple and minimum number Banana
18.
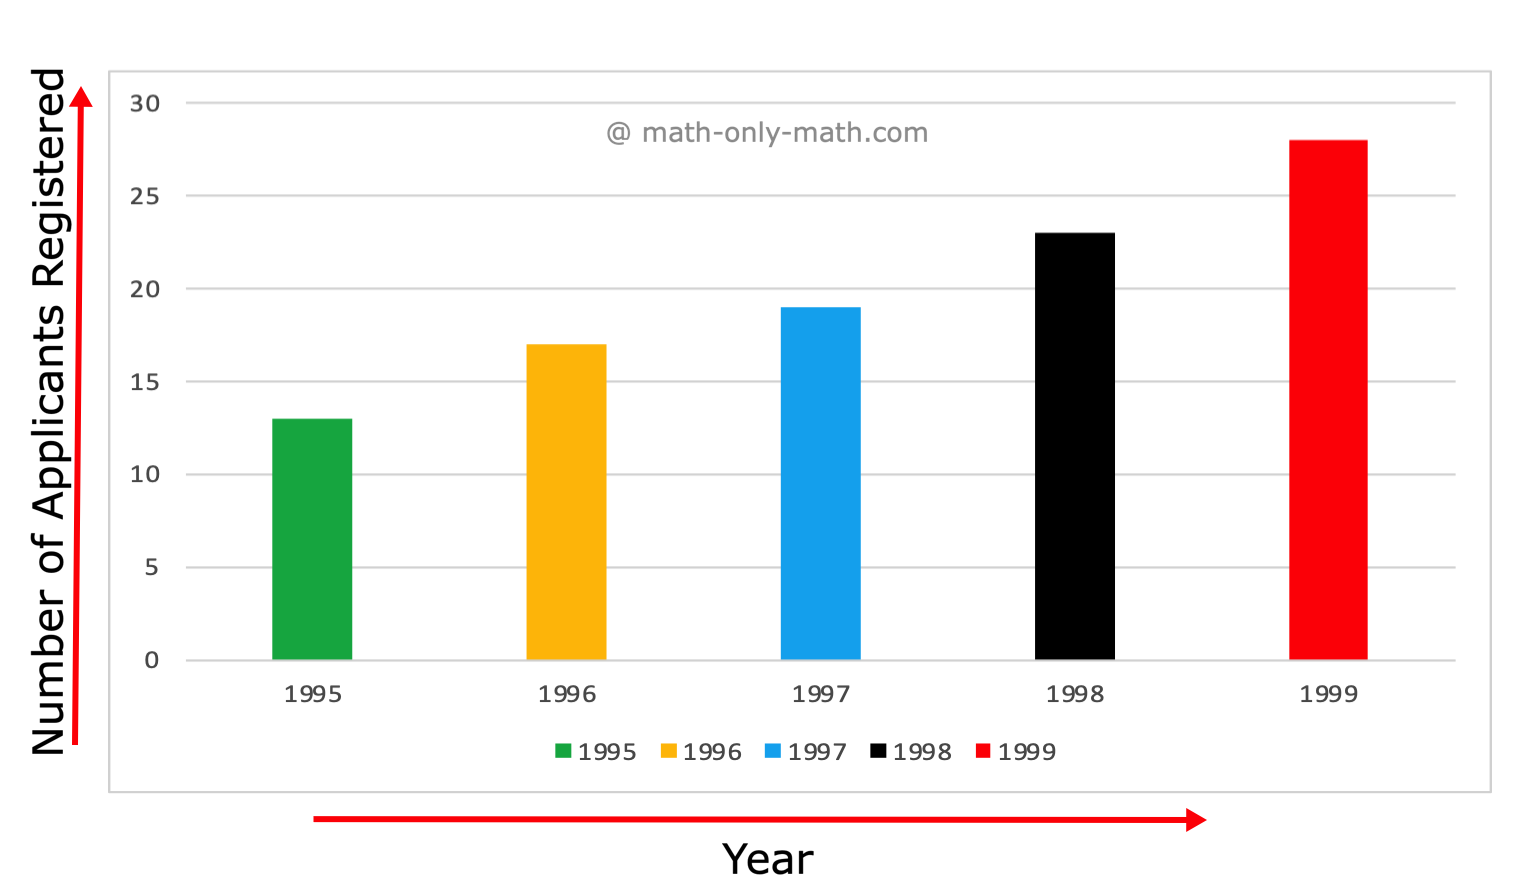
Maximum 1999 and minimum 1995
19.
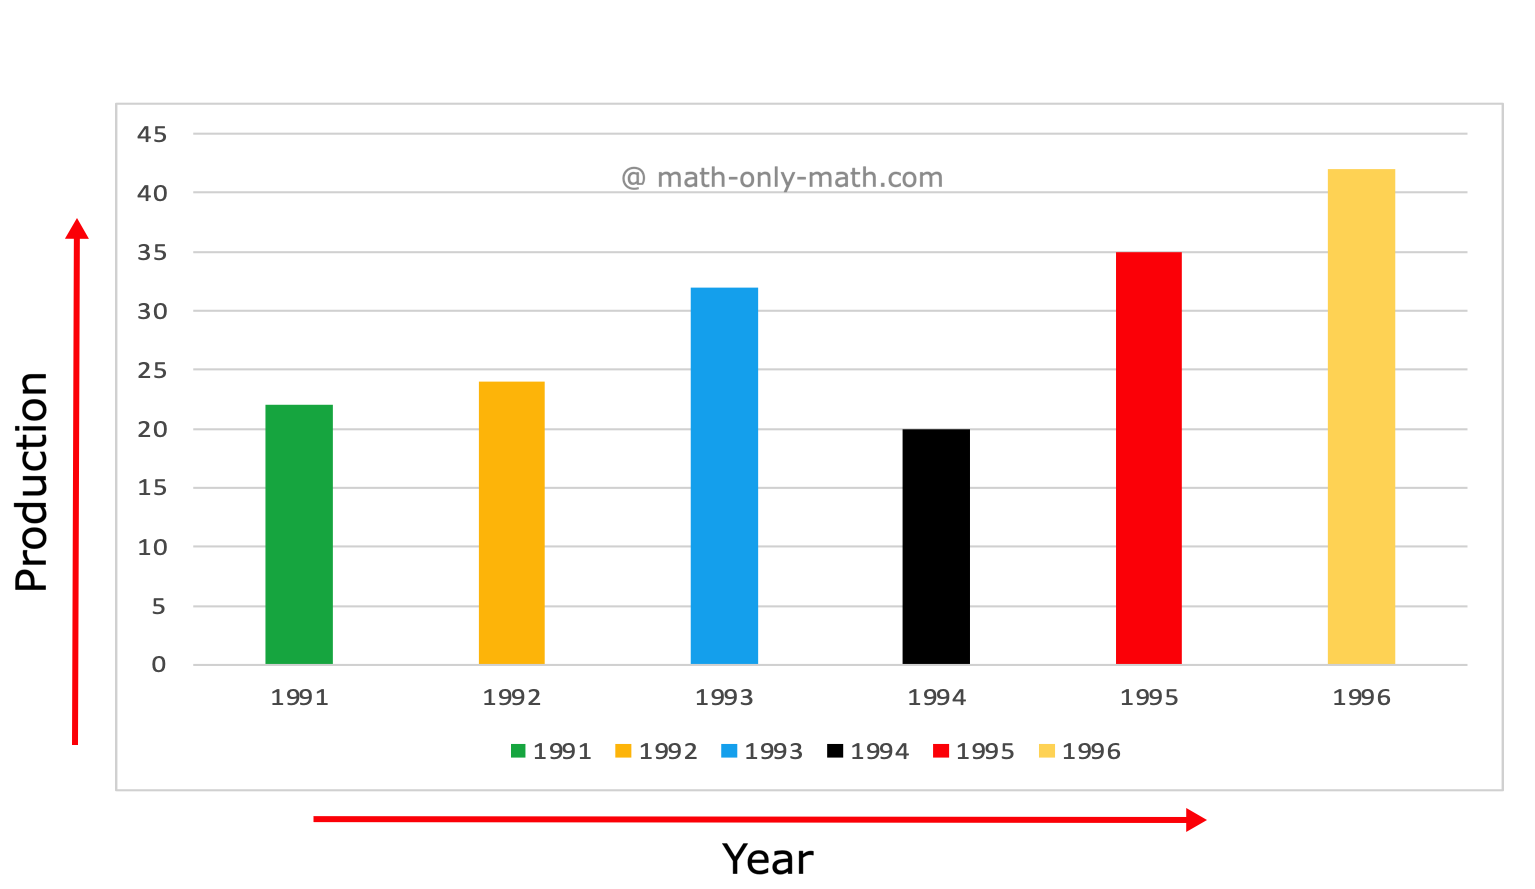
(i) There was trend of increase in the year 1991, 1992, 1993, but there was sudden trend of decrease in the production in the year 1994 and then again the trend of increase in the production in the year 1995 and 1996.
(ii) 1996
(iii) 1994
(iv) 1994
20. (i) 1995, 1998
(ii) 1994, 1995, 1998
(iii) 1996
(iv) 1997
● Statistics – Worksheets
From Worksheet on Bar Graph to HOME PAGE
Didn’t find what you were looking for? Or want to know more information
about Math Only Math.
Use this Google Search to find what you need.


2 Comments
https://shorturl.fm/k9wrl
https://shorturl.fm/jY1jN