

Structure evaluation
The FT-IR spectrum displays multiple necessary vibrational signatures associated with the EC composite. A minor peak at 1374 cm− 1 signifies the presence of methyl vibrations, which are associated with the -CH3 stretching within the 2970–2880 cm− 1 range. In addition, the stretching vibrations related to the C-O-C bond present in cyclic ethers manifest at a peak of 1053 cm− 1. FT-IR analysis supports established conclusions, as shown in Fig. S1a. Notably, the spectra of pure polystyrene and the composites exhibited no discernible differences, suggesting that the aromatic structure of polystyrene is present at 3026, 1602, and 1446 cm− 1, as identified in FT-IR fingerprinting studies24. The FT-IR spectrum of the ECPS composite shows only slight changes in these characteristic bands. As depicted in Fig. S1b, the vibrational peaks characteristic of the symmetric and asymmetric modes of the carboxylate anion in UiO-66-NH2 appear at 1441, 1381, and 1247 cm− 1. Additionally, the vibrational mode observed at 766 cm−1 is associated with Zr-O stretching, while the peaks identified at 485 cm−1 correspond to N-H bending6,25. FT-IR spectra analysis indicates that CN stretching vibrations generate multiple bands within the wavenumber range of 500 to 1900 cm− 1, with new bands observed at 1257 and 1340 cm− 1. The confirmation of the NH2 group is indicated by absorption bands observed at 1619, 3367, and 3453 cm− 1, while the symmetric stretching vibrations related to the COO group show a consistent decline in wavenumber. Furthermore, the incorporation of the NH2 substituent on the benzene ring results in C-H vibrational modes that are characterized by a peak at 768 cm1. A peak at 3343 cm− 1 indicated the presence of the stretching vibration of the -OH functional group. The range 1690 –1214 cm− 1 includes OCO stretching of BDC, C = O stretching of carboxylic acids, and C = C stretching in the benzene ring. The binder exhibits peaks at 1041 and 2972 cm− 1 for the stretching vibrations of C–O–C, C–H. Broad peak (948–1147 cm− 1) indicates glycosidic ring asymmetric stretching vibrations. In the UiO-66-NH2-EDTA sample (Fig. S1c), a newly identified peak at 1248 cm− 1 is evident in the FT-IR spectrum, which is associated with the stretching vibrations of C-N functional groups, thereby indicating the successful incorporation of EDTA onto UiO-66-NH2. The OCO stretching vibrations linked to the BDC ligand can be characterized by the stretching vibrations of the C = O bond in carboxylic acids and the C = C bond in benzene rings, with spectral peaks detected between 1690 and 1248 cm− 1. Furthermore, the stretching vibrations of the COC and CH functional groups are indicated by peaks at 1049 cm− 1 and 2950 cm− 1, respectively. The fluctuations of the broad peak, ranging from 1040 to 1176 cm− 1, are due to the asymmetric stretching vibrations associated with the glycosidic ring19.
As illustrated in Fig. S1d, FTIR spectra show stretching vibrational modes νasym (N-H) at 3483 cm− 1 and νsym (N-H) at 3350 cm− 1 for MIL-125-NH2. The vibrational frequencies ranging from 1350 to 1650 cm− 1 were linked to the carboxylate groups associated with the titanium-oxo clusters. Additionally, spectral analysis showed C-O and C-N stretching modes at 1200–1400 cm− 1.
The presence of the amine functional group (NH2) in the synthesized MIL-125-NH2 (Ti) was indicated by the CN stretching vibration observed at 1256 cm− 1.
FTIR spectra in Fig. S1d confirm symmetric/asymmetric carbonyl stretching (1450–1350 cm-1, 1600–1500 cm− 1) and O-Ti-O vibrations (400, 800 cm− 1). The absence of a primary amine spectral band in MIL-125-NH2 (Ti) likely stems from the strong interaction between metal-oxo cluster hydroxyl and organic linker amino groups26.
FTIR spectra of ZIF-8 (Fig.S1e) show imidazole ring bending: in-plane 1350–1500 cm− 1, out-of-plane 758–692.4 cm− 1. At a frequency of 1420 cm− 1, the imidazole ring demonstrates stretching vibration, whereas the C = N bond in 2-MIM resonates at 1574 cm− 1. Moreover, the Zn-N stretching mode is denoted by a separate band at 421 cm− 121.
XRD analysis explored the crystalline structures of MOF powders and composite fibers. The study encompassed a variety of powders, including EC, Polystyrene, UiO-66-NH2, UiO-66-NH2-EDTA, MIL-125-NH2, and ZIF-8, as well as fibers such as ECPS, UiO-66-NH2/ECPS, UiO-66-NH2-EDTA/ECPS, MIL-125-NH2/ECPS, and ZIF-8/ECPS illustrated in Fig. 1. The XRD pattern of EC showed two broad diffraction peaks, which are characteristic of its amorphous structure (Fig. 1a), aligning with earlier studies27,28. The XRD patterns of ECPS exhibited characteristics associated with the presence of EC and PS nanofibers.
For UIO-66-NH2 crystals, distinct peaks were noted at angles of 7.9°, 9.1°, 12.6°, 17.6°, 22.7°, 26.2°, and 31.2°6. As illustrated in Fig. 1b, The XRD analysis of UIO-66-NH2/ECPS reveals distinct peaks at 7.41°, 9.1°, 12.6°, 14.71°, 17.41°, 22.7°, 25.71°, 26.2°, 30.61°, 31.11°, and 43.61°, which are in agreement with the established diffraction pattern for UiO-66-NH229,30.
XRD patterns after 25 recycling tests confirm UIO-66-NH2 presence in recycled UIO-66-NH2/ECPS nanocomposites. XRD analysis was conducted to evaluate the effects of EDTA modification on the structural characteristics of UiO-66-NH2. The results revealed that the XRD pattern of UiO-66-NH2-EDTA was in close alignment with the pattern observed for UiO-66-NH2, with additional peaks associated with EDTA appearing in the 2θ range of 20°–35° (Fig. 1c). Following 25 cycles of recycling, the recycled UiO-66-NH2-EDTA/ECPS displayed an XRD pattern that was comparable to that of the initial sample, this observation substantiates the continuous existence of UiO-66-NH2-EDTA within the nanocomposites. The XRD results for the ZIF-8/ECPS fiber samples, illustrated in Fig. 1d, showed a strong resemblance to the ZIF-8 pattern, confirming the successful growth of ZIF-8 on the ECPS fiber. The XRD pattern for ZIF-8 exhibited sharp, distinct peaks, thereby confirming the high crystallinity of the material, consistent with previous studies21. Characteristic peaks for ZIF-8 were identified at 7.30°, 10.35°, 12.70°, and 14°. Throughout the adsorption process, these peaks remained stable, indicating that the crystalline structure of ZIF-8 was preserved30. XRD confirmed verified the retention of ZIF-8 within the recycled ZIF-8/ECPS composite following 25 cycles. XRD analysis showed prominent peaks of MIL-125-NH2 in both MIL-125-NH2 and MIL-125-NH2/ECPS (Fig. 1e). After 25 cycles, recycled MIL-125-NH2/ECPS retained characteristic peaks at 6.8°, 9.7°, 11.6°, 15.1°, 17.9°, and 19.5°31.

XRD spectrum of ECPS, MOF powder, MOF/ECPS, and MOF/ECPS after 25 recycles.
The adsorption-desorption technique was utilized to evaluate pore volume, pore size distribution, and surface area of nanofibers and nanocomposites via BET analysis, the findings presented in Table 1.
In contrast to MOF powders, the composites reveal lower values in total pore volumes, surface areas, and average pore diameters. This decrease can be attributed to the obstruction of specific pores resulting from the incorporation of nanofibers.
Specifically, the average pore diameters of the four composites are smaller than that of the ECPS fiber, indicating the inclusion of MOFs contributes to the obstruction of pores within these composite materials. Analysis of the mean pore diameter indicates that the entrapment of sodium ions is enhanced by ECPS fibers via physical mechanisms, whereas the synthesized metal-organic frameworks (MOFs) engage in chemical interactions with sodium ions, effectively immobilizing Na ions within the nanocomposites.

Adsorption-desorption isotherms of ECPS, MOF powder, MOF/ECPS, and MOF/ECPS after 25 recycles.
Interestingly, ZIF-8/ECPS composites show a significant decline in average pore diameter. This can be explained by the size of the ZIF-8, which filled the ECPS pores during synthesis of the composite. SEM images support this conclusion, providing additional support for the significance of ZIF-8 in influencing the pore structure of the composite. N2 isotherms for UIO-66-NH2 are shown in Fig. 2. The N2 adsorption-desorption isotherms for UIO-66-NH2, UIO-66-NH2-EDTA, MIL-125-NH2, and ZIF-8 powders (Fig. 2), exhibit a characteristic type IV (a) behavior. Conversely, the composites UIO-66-NH2/ECPS, UIO-66-NH2-EDTA/ECPS, MIL-125-NH2/ECPS, and ZIF-8/ECPS are classified as exhibiting type II behavior Following the benchmarks established by the International Union of Pure and Applied Chemistry. A mesoporous adsorbent without macropores typically presents a nearly horizontal Type IV isotherm in the upper range of p/p0. Macropores can introduce deviations from the horizontal trend near p/p0 = 1, which poses challenges in determining the total pore volume when examining a composite Type IV + Type II isotherm in this particular situation.
Mesoporous structures typically produce Type IV isotherms, where adsorption dynamics depend on interactions between condensed molecules and those between adsorbent and adsorbate. Pore condensation follows monolayer and multilayer adsorption on mesopore surfaces, aligning with the characteristics of a Type II isotherm. Hysteresis is closely related to capillary condensation, especially in the case of a Type IVa isotherm. It starts to appear when pore diameters are around 4 nm or larger. In this scenario, the filling of micropores is strongly linked to the significant uptake seen at low relative pressures (p/p0), even though the adsorption branch of the H4 loop shows features of both Type I and Type II isotherms. It is important to highlight that the H4 loop has largely retained its original structure. The typical range for utilizing the Brunauer-Emmett-Teller (BET) method in Type II or Type IV (a) isotherms usually falls between p/p0 values of 0.05 and 0.3. Analyzing different materials indicates that MIL-125-NH2 and UIO-66-NH2-EDTA powders do not possess macropores, whereas ZIF-8 and UIO-66-NH2 powders demonstrate the presence of macroporosity. This observation is consistent with earlier findings on MIL-15-NH2, which further supports its microporous nature.
Upon evaluating the adsorption features of UiO-66-NH2/ECPS, UiO-66-NH2-EDTA/ECPS, MIL-125-NH2/ECPS, and ZIF-8/ECPS, it is evident that there is a marked decline in pore volume in comparison to their unmodified MOFs, approaching the pore volume characteristic of the ECPS fiber. The adsorption and desorption isotherms of UIO-66-NH2, UIO-66-NH2-EDTA, ZIF-8, and MIL-125-NH2 reveal a slight hysteresis, which implies an enhancement in mesopore content in the sequences of UIO-66-NH2/ECPS, UIO-66-NH2-EDTA/ECPS, and MIL-125-NH2. When ranked by the degree of hysteresis and pore characteristics, the order is as follows: MIL-125-NH2 powder 2-EDTA powder 2 powder
This observation also applies to the nanocomposites, including UIO-66-NH2/ECPS, UIO-66-NH2-EDTA/ECPS, MIL-125-NH2/ECPS, and ZIF-8/ECPS, which enhances their potential use in membrane technology and ion fixation. Notably, the sizes of the micropores also decreased, with UIO-66-NH2 having the largest micropore sizes and MIL-125-NH2/ECPS showing the smallest.
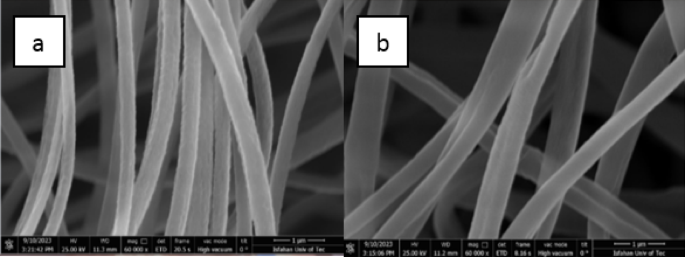
SEM images of fiber: (a) ethyl cellulose, (b) ethyl cellulose-polystyrene.
These results highlight the intricate relationship between pore structure and material performance in these nanocomposites. The investigation into the structural features and size of the generated nanoparticles was supported by images obtained via FE-SEM analysis. The FE-SEM images of the electrospun composite polymer scaffolds are shown in Fig. 3. In Fig. 3a, the morphology of the electrospun Ethyl Cellulose nanofibrous structure is prominently displayed. Furthermore, Fig. 4b indicates that the two polymers: Ethyl Cellulose and Polystyrene are effectively blended, leading to a minor increase in fiber diameter. The successful deposition of MOF crystals onto the surface of electrospun composite polymer scaffolds (ECPS) is confirmed by the FE-SEM and EDS result. Figures 4, 5 and 6 show FE-SEM images of MOFs and nanocomposites.

SEM images of powders: (a) UIO-66-NH2, (b) UIO-66-NH2-EDTA, (c) ZIF-8, and (d) MIL-125-NH2.
The FE-SEM pictures show UIO-66-NH2, UIO-66-NH2-EDTA, MIL-125-NH2, and ZIF-8 powders (Fig. 4). Fibers and MOFs particles’ average size was estimated using the Image J program, as indicated in Table 2.

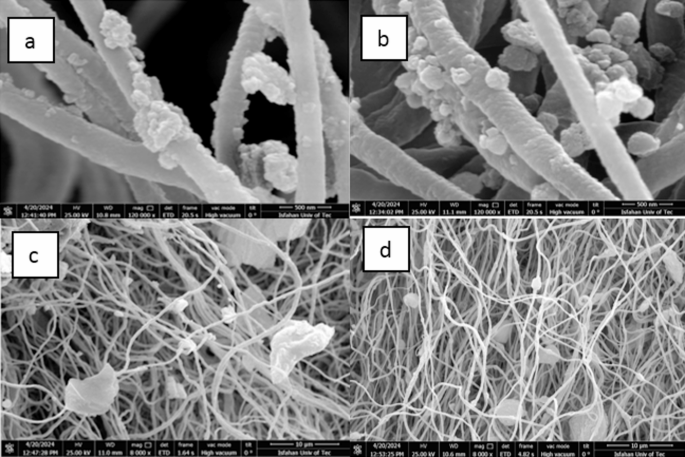
SEM images of MOF/ECPS: (a) UIO-66-NH2/ECPS, (b) UIO-66-NH2-EDTA/ECPS, (c) ZIF-8/ECPS, and (d) MIL-125-NH2/ECPS.
SEM images of MOF/ECPS after 25 recycles (a) UIO-66-NH2/ECPS, (b) UIO-66-NH2-EDTA/ECPS, (c) ZIF-8/ECPS, and (d) MIL-125-NH2/ECPS.
The images illustrate a uniform fiber structure within the electrospun networks, suggesting the absence of knots in the electrospun (EC) and electrospun composite polymer systems (ECPS) nanofibrous arrangements. This consistency indicates that the synthesis and deposition processes used in the study were successful. The EDX and mapping analysis results, illustrated in Figs. S2 and S5–S9, verify the presence of zirconium (Zr) in UIO-66-NH2, UIO-66-NH2-EDTA, UIO-66-NH2/ECPS, and UIO-66-NH2-EDTA/ECPS. Furthermore, titanium (Ti) was identified in MIL-125-NH2 and MIL-125-NH2/ECPS, while zinc (Zn) was detected in both ZIF-8 and ZIF-8/ECPS.
The thickness of the ECPS nanofibers is slightly more than that of the EC nanofibers. These ECPS nanofibers were coated with UiO-66-NH2, UiO-66-NH2-EDTA, and ZIF-8 nanoparticles, which displayed unique shapes: rhombic dodecahedrons and regular octahedrons (as shown in Fig. 5). This indicates that the synthesis of MOFs on the nanofibers was successful. Additionally, a comparison of FE-SEM pictures shows UIO-66-NH2 intercalation on fiber surfaces, emphasizing the significance of nanoscale synthesis of UIO-66-NH2 and UIO-66-NH2-EDTA on ECPS nanofibers.
This nanoscale coating enhances pore accessibility and increases the efficiency of the synthetic structures. The surface of the composite fibers, shown in Fig. 5c, displays a multitude of hexagonal-like crystals with diameters between 300 and 500 nm21. These findings validate the successful in situ synthesis and deposition of ZIF-8 crystals onto ECPS fibers, achieved through a completely green procedure that eliminates the need for chemical solvents.
The ex-situ preparation of MIL-125-NH2/ECPS consists of two primary steps. Initially, EC and PS powders are combined with MIL-125-NH2 and DMF. This mixture is then electrospun to create the nanocomposite fiber, this is evidenced by the SEM image depicted in Fig. 5d. The SEM images validate the successful synthesis of nano-sized MOFs on the ECPS fibers, displaying a three-dimensional quasi-cubic tetragonal structure. The MIL-125- NH2 (Ti) nanocrystals take on a rhombic dodecahedron shape, averaging 350 nm in size, consistent with earlier studies26,32.
To effectively incorporate sodium ions, it is crucial to have hydroxyl (OH) and amine (NH2) groups, along with pores of suitable size. Other essential factors include van der Waals and electrostatic forces. EDX was used to determine the samples’ sodium ion (Na+) concentration, which ranged from 1.76 to 11.18% (Fig. S2). The corresponding elemental mapping images (Figs. S5-S9) further confirm the successful incorporation of Na+ into the nanocomposite samples. BET and BJH tests reveal that ECPS and MOF/ECPS nanocomposites exhibit smaller pore volumes and sizes than MOF powders. The small ionic radius of sodium ions allows them to easily permeate the pores and be extracted from salt solutions without difficulty. Notably, the nanocomposites exhibit remarkable stability, retaining their initial sodium ion adsorption capacity even after 25 cycles (Fig. S4). SEM images further highlight the abundant presence of MOFs on the fibers, emphasizing the strong bonding between the MOFs and ECPS (Fig. 6).
To evaluate the stability of the fibers at various pH values, they were immersed for five hours in a 2000 ppm NaCl solution at pH levels of 1 and 9. After immersion, the fibers were rinsed with D.I. water for fifteen minutes, dried, and analyzed using FESEM, EDX, and mapping techniques (Fig. 7). The results, shown in Figs. 7, S10, and S11 reveal that MIL-125-NH2/ECPS fibers maintain the highest stability under extreme pH conditions, while ZIF-8/ECPS fibers show the least stability. In contrast, UIO-66-NH2-EDTA/ECPS fibers demonstrate more excellent stability than UIO-66-NH2/ECPS fibers. The results of the mapping analysis and EDX spectroscopy performed after adsorption are depicted in Fig. S5-S9, confirming the presence of Na+ ions within the structures.
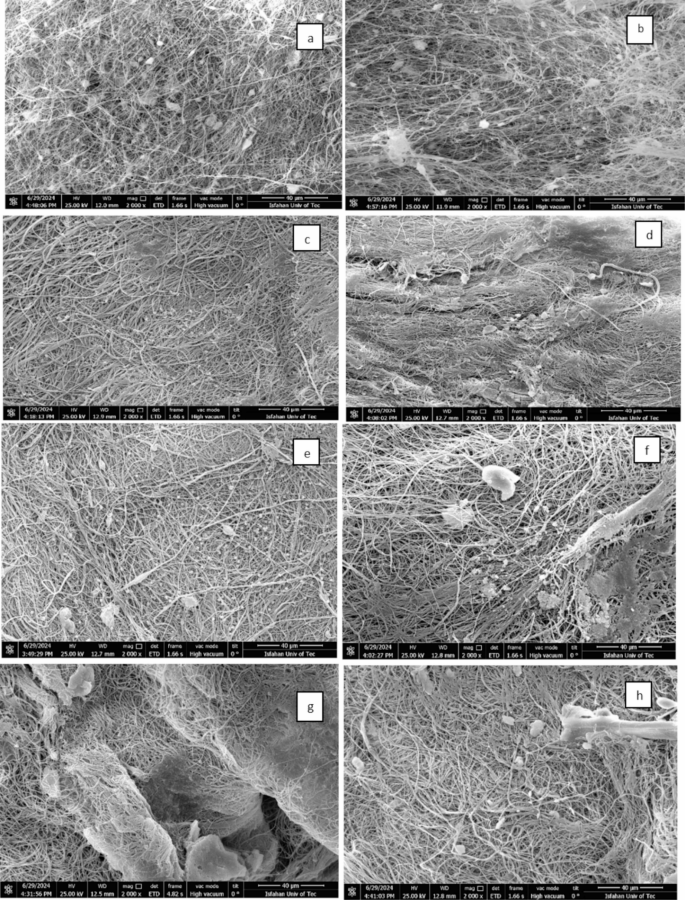
SEM images of MIL-125-NH2 /ECPS: (a) pH = 1, (b) pH = 9; UIO-66-NH2/ECPS (c) pH = 1, (d) pH = 9; UIO-66-NH2-EDTA/ECPS (e) pH = 1, (f) pH = 9; ZIF-8 /ECPS: (g) pH = 1, (h) pH = 9.
TGA analysis examined the weight degradation of ECPS fiber and MOFs/ECPS. Below 320 °C, ECPS experiences minimal weight loss and degradation. As depicted in Fig. 8, the early stage of weight reduction observed in UIO-66-NH2 is primarily caused by residual solvent and the release of water, occurring at temperatures below 250 °C. To fully decompose the amino terephthalate ligand, a temperature of 555 °C is necessary.
The TGA profile of UIO-66-NH2/ECPS indicates the presence of three distinct degradation phases occurring between 200 and 600 °C during the decomposition process. The first phase at 300 °C loses solvent molecules. The second phase, occurring at approximately 350 degrees, is characterized by the breakdown of the nanocomposite structure, the collapse of the framework, the degradation of the ligand, and the disruption of chemical bonds within the MOF/ECPS combination. Also, The UIO-66-NH2-EDTA degrades in two stages. Because solvent molecules are present, the first weight loss happens at about 100 °C. The next stage is distinguished by the breakdown of chemical bonds in the MOF, as well as ligand degradation after 300 °C, which contributes to the collapse of the MOF structure.
The UIO-66-NH2-EDTA/ECPS composite degrades in three stages, as evidenced by the weight of UIO-66-NH2-EDTA/ECPS remaining unchanged beyond 300 °C. The first weight loss was observed at approximately 300 °C, and involves the loss of solvent molecules. The next stage is characterized by the breakdown of newly formed chemical bonds in the MOF and ECPS mixture, as well as ligand degradation between 370 and 450 °C, which contributes to the collapse of the nanocomposite structure.
Finally, the EDTA-UiO-66-NH2/ECPS composite disintegrates internally at temperatures between 450 and 600 °C during degradation. Similarly, ZIF-8 has two stages in weight reduction. The initial phase involves the loss of solvent molecules occurring at approximately 200 °C, while the final stage transpires at 550 °C. Similarly, the degradation of ZIF-8/ECPS is comprised of two distinct phases. Initial weight loss, associated with solvent removal, occurs around 350 °C. In the next phase, the chemical bonds within the MOF-ECPS mixture are disrupted, resulting in the collapse of the nanocomposite structure and the degradation of ligands at a temperature of 400 °C.
On the other hand, MIL-125-NH2 powder decreases in weight lacking identifiable phases, whereas MIL-125-NH2/ECPS exhibits a two-stage: the first at around 300 °C, which can be ascribed to the removal of solvent molecules, and the second at around 450 °C, is associated with the disintegration of the nanocomposite structure. Overall, the data suggest that all of the MOFs analyzed exhibit signs of degradation at temperatures below 300 °C. However, compared to pure MOF powders, the nanocomposites’ thermal stability is noticeably higher, suggesting that the ECPS fibers allow the MOFs to withstand higher temperatures without degrading.

TGA curves of ECPS, MOF powder, and MOF/ECPS.
The process of ionizing the constituent elements of a sample is achieved through Inductively Coupled Plasma (ICP) Spectroscopy. In this instance, the formation of MOFs requires the presence of zirconium (Zr), zinc (Zn), and titanium (Ti). Their existence suggests that MOFs have been included in the nanocomposite. Among the four nanocomposites studied, ZIF-8/ECPS shows the highest weight loading, while MIL-125-NH2/ECPS has the most significant loading percentage. This discrepancy is probably explained by the different synthesis techniques that were employed; MIL-125-NH2/ECPS was created through an ex-situ method, whereas the other three were synthesized in situ (Table 3).
Contact angle measurements were performed to predict polar components and surface wettability33,41.

Contact angle and SEM related: (a) UIO-66-NH2/ECPS, (b) UIO-66-NH2-EDTA/ECPS, (c) ZIF-8/ECPS, and (d) MIL-125-NH2/ECPS.
This variation in synthesis techniques may clarify the differences in loading characteristics seen in the samples. The outcomes are represented in Fig. 9 and outlined in Table 4. The analysis reveals that the UIO-66-NH2/ECPS fibers possess complete hydrophilic properties, while the MIL-125-NH2/ECPS fibers are characterized by their total hydrophobic nature. Alternatively, the UIO-66-NH2-EDTA/ECPS and ZIF-8/ECPS fibers exhibit amphipathic (or amphiphilic) properties. Notably, the hydrophilicity of UIO-66-NH2/ECPS fibers provides more active sites for interaction compared to other hydrophobic materials, enhancing their capacity to remove Na+ ions while competing with H+ ions.
Incorporating nanoparticles into ECPS fibers significantly enhances the properties of the resulting nanocomposites, resulting in higher elastic modulus and tensile strength. As illustrated in Fig. 10, the robustness of in-situ nanocomposites is significantly greater than that of ex-situ MIL-125-NH2/ECPS composites. Specifically, the tensile strength of UIO-66-NH2/ECPS, UIO-66-NH2-EDTA/ECPS, and ZIF-8/ECPS shows impressive increases of 131%, 96.12%, and 129.45%, respectively, when compared to the tensile strength of pure ECPS. In contrast, the ex-situ preparation method for MIL-125-NH2/ECPS results in a notable decline in tensile strength, measuring only − 56.8% of that of ECPS. This remarkable improvement in the mechanical strength of UIO-66-NH2/ECPS, EDTA-UiO-66-NH2/ECPS, and ZIF-8/ECPS can be linked to the strong attachment of metal-organic framework (MOF) nanoparticles to the fiber surface, which enhances the overall integrity and durability of the nanocomposites.

Tensile strength of (a) ECPS and MIL-125-NH2/ECPS; (b) UIO-66-NH2/ECPS, UIO-66-NH2-EDTA/ECPS, and ZIF-8/ECPS.
NaCl adsorption study
One of the aims of this investigation is the ascertaining the best circumstances for the adsorption of positively charged sodium ion by the UIO-66-NH2/ECPS and UIO-66-NH2-EDTA/ECPS, MIL-125-NH2/ECPS, and ZIF-8/ECPS nanocomposites (Fig. 11).

The different steps of the adsorption process.
The quantification of sodium ion (Na+) adsorption was conducted utilizing atomic absorption spectroscopy. It was noted that the adsorption process led to a reduction in the concentration and absorption of Na+. The formula specified in Eq. (1) served as the basis for calculating the adsorption capacity:
$${q_e}=\left( {\left( {C0 – Ce} \right)V} \right)/M$$
(1)
C0 is the initial Na+ concentration; Ce is the equilibrium concentration (mg. L– 1). The volume of the solution is V (L) and the mass of the adsorbent is M (g)34. Electrospun fibers obtained from mixing EC and PS polymer solutions were utilized for Na+ adsorption from 2000 ppm NaCl solution. The majority of sodium ion (Na+) adsorption was associated with electrospun fibers that utilized an EC2PS1 mixing ratio (Fig. 12a).
Adsorption experiments
Effect of ethylcellulose polystyrene ratio
The proportion of the mixture of ethyl cellulose (EC) and polystyrene (PS) significantly influences the mechanical properties of the resulting fibers, specifically their robustness and flexibility. An increase in the concentration of EC correlates with enhanced robustness, whereas a higher proportion of PS contributes to increased flexibility. The ratios evaluated in this study include 1:1, 2:1, 3:1,1:2, and 1:3. Among the various solutions with differing mixing ratios, the EC2PS1 solution exhibits the highest level of Na + adsorption (Fig. 12a).
Effect of initial NaCl concentration
The optimization of the initial sodium chloride (NaCl) concentration is essential in adsorption studies, as it plays a significant role in influencing mass transfer resistance. In the present investigation, we systematically varied the NaCl concentration within the range of 1000 to 6000 ppm to assess its impact on the sodium ion adsorption performance of MOF/ECPS composites (refer to Fig. 12b). The results indicated that the Na + adsorption capacity peaked at a concentration of 2000 ppm. Conversely, the removal efficiency declined at elevated initial concentrations exceeding 4000 ppm. This phenomenon can be attributed to the attainment of equilibrium at the 2000 ppm Na+ concentration, resulting in the complete saturation of the adsorbent‘s active sites35.
Effect of contact time
Equilibrium time is a significant factor in the process of water desalination. Figure 12c illustrates the effect of contact time (0–720 min) on the adsorption of Na+. The adsorption of Na + occurred within the initial 60 min of contact time, which can be attributed to the high availability of unoccupied adsorption sites for Na+. Following this period, the percentage of Na + removal stabilized and reached its maximum value, likely due to the depletion of accessible active sites for further adsorption. Therefore, a contact duration of 60 min has been identified as the optimal period for this process36.

(a) Different mixing ratios of ethylcellulose and polystyrene (b) different initial concentrations of NaCl solution; (c) the effect of time on Na+ adsorption.
Effect of pH
The study assessed how pH variations affect the adsorption capacity of four novel nanocomposites. Figure 13a illustrates the effect of pH (1, 3, 5, 7, and 9) on Na+ adsorption. At pH values of 3 and 5, respectively, UIO-66-NH2/ECPS and UIO-66-NH2-EDTA/ECPS exhibit the maximum adsorption capacity. On the other hand, the ZIF-8/ECPS and MIL-125-NH2/ECPS composites function best at pH 7. The ability of UIO-66-NH2/ECPS to maintain stability in acidic environments highlights its potential for effectively removing sodium ions at a pH level of 3. This performance is likely due to the hydrophilicity of UIO-66-NH2/ECPS, which offers more active sites for Na+ adsorption compared to other hydrophobic composites. At pH 5, the improved Na+ removal can be attributed to the presence of the chelating agent EDTA, which facilitates the adsorption process. Additionally, the negatively charged sites and the strongly electrostatically interacting positively charged Na+ ions on the surfaces of ZIF-8/ECPS and MIL-125-NH2/ECPS composites are primarily responsible for their remarkable adsorption efficiency. Overall, the findings underscore the significance of pH in enhancing the sodium ion (Na+) adsorption capacity of composites37.
Effect of temperature
Na + ions adhere better at low temperatures, as evidenced by the exothermic nature of Na + adsorption for MIL-125-NH2/ECPS and ZIF-8/ECPS composites, which exhibit maximum adsorption at 25◦C. The most likely explanation for this phenomena is that the interaction between the adsorbent and the Na + ions was diminished by heat energy. Therefore, designing an efficient adsorbent requires a deep understanding of temperature. The results are shown in Fig. (13b)38 .
MOF percent in composite Preparation
Optimizing the usage of MOFs for desalination is the goal of this study.The variable that requires determination is the percentage of MOF loading(The quantity of starting materials specified in the instructions has been modified, with adjustments ranging from 25 to 200%) on Electrospun ECPS fibers during the in-situ synthesis of UIO-66-NH2/ECPS, UIO-66-NH2-EDTA/ECPS, and ZIF-8/ECPS, as well as the ex-situ synthesis of MIL-125-NH2/ECPS. An optimal weight% of MOF is essential to enhance the number of active sites, thereby maximizing adsorption capacity. Conversely, ECPS fibers possess appropriate pore structures that facilitate the entrapment of Na + ions; thus, the balance between these distinct functionalities is critical in determining the optimal combination of MOF percentage and ECPS fibers. The study identified that the most effective concentrations were 25% for UIO-66-NH2, 50% for both UIO-66-NH2-EDTA and ZIF-8, and 60% for MIL-125-NH2 (Fig. 13c).
Effect of adsorbent dosage weight
For efficient removal of Na+, it is crucial to achieve the optimal dosage of the adsorbent. Figure 13d illustrates the effect of different adsorbent dosages (0.05–0.012 g) on Na+ adsorption. It is evident that the dosage weight of 0.008 g for ZIF-8/ECPS, UIO-66-NH2/ECPS and 0.004 g for UIO-66-NH2-EDTA/ECPS and MIL-125-NH2 have the maximum adsorption.This phenomenon may be attributed to the high availability of adsorption sites, which facilitate the adsorbent’s ability to attract Na + ions. Consequently, only a minimal quantity of the adsorbent, measured in milligrams, is adequate for effective Na + ion adsorption, negating the necessity for an increased dosage of the adsorbent. Furthermore, it was observed that increasing the adsorbent dosage beyond the optimal levels did not result in a significant enhancement of the adsorptive capacity.

Na+ adsorption is affected by (a) pH, (b) Temperature, (c) MOF percentage, and (d) The dosage weight of adsorbents.
Under these optimized conditions, the sodium ion (Na+) adsorption capacities for the different adsorbents were as follows: 529 mg Na+/g fiber for MIL-125-NH2/ECPS, 546 mg Na+/g fiber for ZIF-8/ECPS, 552 mg Na+/g fiber for UIO-66-NH2, and 560 mg Na+/g fiber for UIO-66-NH2-EDTA/ECPS (Fig. 14).

Enhancing Na+ adsorption of UIO-66-NH2 with EDTA modification.
The conditions deemed optimal for achieving effective adsorption capacity and efficiency of MOFs/ECPS nanocomposites in the adsorption of Na+ are summarized in Table 5.
The adsorption mechanism can be explained as: The Na+ ion can be physically trapped by ECPS fibers with pores, whereas MOFs with functional groups like NH2 and OH (found in UiO-66-NH2-EDTA, UiO-66-NH2, and MIL-125-NH2), EDTA (found in UiO-66-NH2-EDTA), and N atoms (found in the imidazole ring of ZIF-8) can chemically adsorb the Na+ ion through their electrostatic attraction.
The adsorption capacity of the four novel MOF/ECPS composites was significantly higher than that of the ECPS fiber. The Na+ adsorption capacities for the composites were recorded as follows: 529 mg Na+/g for MIL-125-NH2/ECPS, 546 mg Na+/g for ZIF-8/ECPS, 552 mg Na+/g for UIO-66-NH2/ECPS, and 560 mg Na+/g for UIO-66-NH2-EDTA/ECPS, and 507 mg Na+/g for ECPS fiber. These findings underscore the efficiency of the adsorbents under specific conditions, offering valuable insights for future applications.
The analysis of salt adsorption on UIO-66-NH2-EDTA/ECPS nanocomposites, summarized in Table 6, indicated the effective adsorption of various salts from a solution containing 2000 mg/L of each salt: NaCl, KCl, CaCl2, and MgCl2. The results confirm that this nanocomposite is capable of spontaneously removing both monovalent and divalent salts.
MOFs have high adsorption capacities; however, it is essential to assess their recyclability. Given that MOFs may not be easily repurposed, their potential for reuse significantly enhances their value, especially when compared to their high adsorption capacities, which are frequently associated with single-use applications. (See Fig. 15). This suggests that it is essential to achieve a balance between performance and sustainability in the development of these nanocomposites.

Fibers, MOF, and MOF/ECPS Na+ adsorption comparison.
The percentage of Na+ adsorption in the MOF/ECPS nanofibers is lower than that of pure MOFs, as shown in Fig. 15. However, it’s worth noting that pure MOFs can only be used for a single adsorption cycle. In contrast, the composites can be employed for up to 25 cycles. The exception is MIL-125-NH2, which remains effective for eighteen cycles without a significant drop in adsorption capacity (Fig. 16). After each cycle, a 0.1 mol⋅L− 1 HCl solution served as the eluent39.
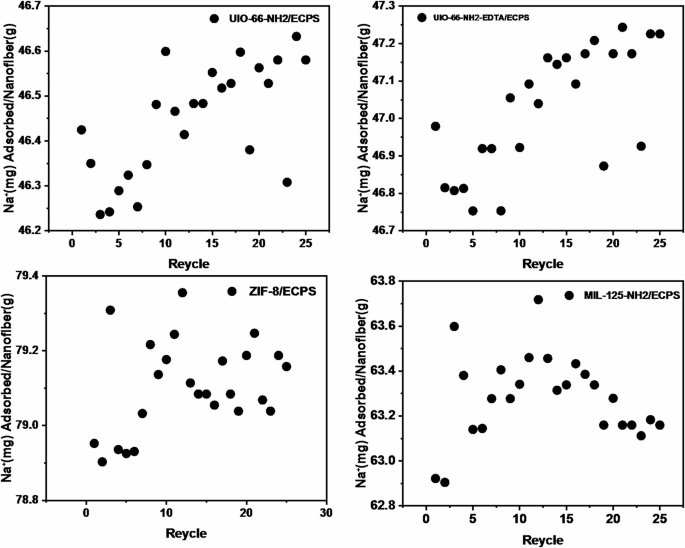
Recyclability of nanocomposites in Na+ adsorption: (a) UIO-66-NH2, (b) UIO-66-NH2-EDTA, (c) ZIF-8/ECPS and (d) MIL-125-NH2/ECPS.
Kinetic study
The research investigates the adsorption of Na+ by various nanocomposites, achieved by immersing each sample in 20 ml of a 2000 ppm NaCl solution. To investigate the kinetics associated with adsorption, three different empirical models were utilized: a pseudo-first-order model Eq. (2), a pseudo-second-order model Eq. (3), and a diffusion-adsorption model within the particles Eq. (4). The linearized forms of these equations are as follows:
$$Ln\left( {qe – qt} \right)\,=\,lnqe – k1t$$
(2)
$$t/qt\,=\,1/{k_2}q{e^2}+\left( {1/qe} \right)t$$
(3)
$$qt\,=\,kid{t^{1/2}}+Ci$$
(4)
In these equations, the variable qe represents the equilibrium adsorption capacity in the solution, while qt denotes the quantity of salts adsorbed at a specific time t. The time variable t is measured in minutes. In the context of the pseudo-first-order, pseudo-second-order, and intraparticle diffusion models, the rate constants are identified as k1, k2, and kid, respectively. The parameter Ci serves as an indicator of the boundary layer’s thickness. The k1 value was calculated using the slope of ln (qe – qt) plotted against time, as presented in Fig. S12. The investigation revealed that all chemicals exhibited low correlation coefficients (R2) when analyzed using the pseudo-first-order model, as outlined in Fig. S13.On the other hand, the pseudo-second-order model showed R2 values over 0.99 for all nanocomposites studied, with the sole exception of MIL-125-NH2/ECPS. Table S1 details K1, R2, K2, and q values for pseudo-first and second-order models. Pseudo-second-order model fits Na+ adsorption on UIO-66-NH2/ECPS, UIO-66-NH2-EDTA/ECPS, MIL-125-NH2/ECPS, and ZIF-8/ECPS. Notably, the computed qe values for the nanocomposites were extremely close to the experimental qexp values. The transfer of electrons between MOF/ECPS adsorbent and sodium ions defines chemical interactions in the adsorption process.
Intraparticular diffusion
To explore intraparticle diffusion, we utilized the interparticle diffusion model, Frequently referred to as the Weber–Morris model. This model outlines three distinct stages of diffusion: adsorption, surface diffusion, and intraparticle diffusion. High concentration values (Ci) have a substantial impact on the boundary layer. The rate parameter is defined as the gradient of the curve representing the correlation between adsorbate quantity and the square root of time (t 1/2). This parameter indicates the adsorption rate in samples where the predominant limiting factor is intraparticle diffusion. When the curve begins at the origin of the coordinate system, this implies that the control of the rate-limiting process is attributed mainly to intraparticle diffusion, which establishes a linear relationship between qt and t1/2. However, it is essential to consider that other mechanisms may also influence the overall kinetics alongside intraparticle diffusion.
Figure S14 shows the multiline plots depicting the Na+ adsorption process across different nanocomposites, such as MIL-125-NH2/ECPS, ZIF-8/ECPS, UIO-66-NH2/EDTA/ECPS, and ZIF-66-NH2/ECPS. These plots indicate that the adsorption occurs in two separate stages. First, Na+ ions diffuse through the film from the solution to the external surface of the nanocomposites. After that, intraparticle diffusion occurs as Na+ ions enter the pores of the nanocomposites. Intraparticle diffusion is insufficient alone; both liquid film diffusion and intraparticle diffusion significantly influence the kinetics shown in the nanocomposite model curve. The parameters of the intraparticle diffusion model, along with their respective R2 values, are detailed in Table S2 32, 47.
Elovich
The Elovich model is a well-studied kinetic model used to characterize adsorption processes. It operates on the premise that as the amount of solute adsorbed increases, the adsorption rate decreases exponentially. This model is particularly applicable to processes characterized by second-order kinetics, especially in instances where the adsorption surface displays energetic heterogeneity.
The variations in activation energies observed across these surfaces offer valuable insights into the chemisorptive characteristics of the adsorption process. The equation that follows is intended to demonstrate the mathematical principles associated with the Elovich model:
$$q=(1/\beta )In(\alpha /\beta )+(1/\beta )lnt$$
(5)
In this equation, α denotes the initial adsorption rate (mg g−1 min−1), β represents the adsorption constant (mg g−1 min−1) associated with surface coverage and activation energy required for the process of chemisorption, and qt reflects the adsorption capacity at time t (mg g−1). A linear representation of qt versus ln t allows for determining the parameters α and β. This graphical representation (see Fig. S15) helps us understand the adsorption mechanism on the heterogeneous adsorbent surface, including the possibility of chemisorption. In this linear relationship, the slope and intercept are defined as 1/β and ln (α/β), respectively. Table S3 presents Elovich model correlation coefficients and constants, highlighting ZIF-8/ECPS’s significantly higher initial adsorption rate compared to other nanocomposites. Furthermore, the β values reveal that the chemisorption process of nanocomposites is characterized by low activation energy and desorption rates.
The analysis of adsorption data via linear regression for UIO-66-NH2/ECPS, UIO-66-NH2-EDTA/ECPS, ZIF-8/ECPS, and MIL-125-NH2/ECPS demonstrates a strong compatibility with the pseudo-second-order model. The robustness of this claim is indicated by the high correlation coefficient values (R2: 0.995, 0.996, 0.996, and 0.980, respectively). The lower correlation coefficient values (R2) associated with the pseudo-first-order, Elovich, and intraparticle diffusion models indicate their limited applicability in explaining the adsorption process of Na+ on the UIO-66-NH2/ECPS, UIO-66-NH2-EDTA/ECPS, ZIF-8/ECPS, and MIL-125-NH2/ECPS nanocomposites (Table S5).
Adsorption thermodynamics
The following formulas are used to determine thermodynamic parameters, such as Gibbs free energy (ΔG: kJ mol−1), standard entropy (ΔS: kJ mol−1•K−1), and enthalpy (ΔH: kJ mol−1):
$$Ln\left( {{k_c}} \right)=\Delta {S_0}/R – \Delta {H_0}/RT$$
(6)
$${k_c}={C_a}/{C_e}$$
(7)
$$\Delta {G_0}\,=\,\Delta {H_0} – T\Delta {S_0}$$
(8)
This study shows that equilibrium sodium chloride adsorption on the adsorbent is denoted as Ca (mg L− 1), while solution concentration is represented by Ce (mg L− 1). The adsorption equilibrium constant is denoted by Kc (dimensionless). Furthermore, Gas constant R equals 8.314 J·mol−1·K−1; the temperature of the NaCl solution is represented by T in Kelvin. To ascertain ΔS0 and ΔH0, the intercept and slope derived from the linear relationship between ln (Kc) and 1/T were utilized, as shown in Fig. S16. Table S4 demonstrates that the Gibbs free energy was ascertained by employing Eq. (8). The adsorption process shows spontaneity through consistently negative ΔG° values across various temperature conditions for all MOF/ECPS. In addition, the observation of negative ΔH0 values provides further evidence for the exothermic nature of the adsorption process26.
Isotherms
The study of adsorption isotherms is essential for understanding the interactions between adsorbates, including Na+ ions, and various adsorbent materials, thereby facilitating the optimal use of these adsorbents35 .The present research focuses on analyzing the features of the adsorption isotherm by employing the Langmuir and Freundlich models. Langmuir model’s key principle is single-layer adsorption on a uniformly structured adsorbent surface. This concept is mathematically represented by the Eq. (9):
$${C_e}/{q_e}=1/\left( {{q_{max}} \cdot {k_L}} \right)+\left( {1/{q_{max}}} \right){C_e}$$
(9)
This equation demonstrates the equilibrium adsorption capacity, referred to as qe, in conjunction with the maximum adsorption capacity, indicated as qmax, with both parameters expressed in milligrams per gram (mg.g−1). The equilibrium concentration of Na+ is represented as Ce (expressed in mg L−1), while kL refers to the Langmuir constant, as shown in Fig. S17. An essential element of the Langmuir model is the retention factor RL, which can be assessed by employing the Eq. (10):
$${R_L}=1\left( {1\,+\,{K_L}Ce} \right)$$
(10)
The equilibrium conditions depend on the reaction quotient value (RL). In particular, these conditions are classified as irreversible when RL is equal to 0, favorable when RL is between 0 and 1, unfavorable when RL is greater than 1, and linear when RL is exactly 140. The nanocomposites examined exhibited RL values within the range of 0 to 1, indicating that the equilibrium conditions are conducive to the adsorption of Na + ions. The Freundlich isotherm model was incorporated into our analysis to provide a thorough examination of multilayer adsorption processes.
Equation (11), which is linearized, illustrates the framework of this model:
$$log\left( {{q_e}} \right)\,=\,log\left( {{K_F}} \right)\,+\,1/n log\left( {{C_e}} \right)$$
(11)
In this context, the value 1/n signifies the strength of adsorption, while the constant associated with the Freundlich is referred to as K. When 1/n falls between 0 and 1, the adsorption behavior is considered favorable; when 1/n equals 1, it is irreversible; and when 1/n surpasses 1, it is deemed unfavorable. Fig.s S17 and S18 display the curves corresponding to the Freundlich and Langmuir isotherm models. Moreover, a summary of the adsorption parameters associated with these models is presented in Table S6. The Langmuir model demonstrated a higher coefficient of determination (R2), suggesting it is more effective in describing the adsorption process of Na+. This implies that for the three nanocomposites examined, UIO-66-NH2/ECPS, UIO-66-NH2-EDTA/ECPS, and ZIF-8/ECPS, Sodium ions are adsorbed in a monolayer arrangement. Interestingly, the Freundlich model exhibited a more significant correlation coefficient for the MIL-125-NH2/ECPS nanocomposite, indicating that it functions under a multilayer adsorption mechanism.
Error analysis
To identify the most effective isothermal model, we analyze the correlation coefficient (R2). This metric aids linear isothermal models but has drawbacks. This study implemented three varied error functions to ascertain the isothermal model that best represents the findings obtained from the experiments. Equation (12) illustrates that the most used error function is the sum of squared errors (SSE). A primary shortcoming of this approach is its frequent generation of isotherm parameters suited for the latter parts of the isotherm. This situation arises due to the elevated levels of adsorbate concentration; the errors become more significant, thereby causing the squared errors to accumulate. We additionally analyzed the sum of absolute errors (SAE), as delineated in Eq. (13), to address this issue. At higher concentrations, this error function provides enhanced corrections, particularly when the escalation in error is associated with an expanded concentration range.
Equation (14) mitigates the distribution of errors across various concentration levels, thereby improving the reliability of the analysis.For more detailed results and comparisons, please see Tables S7-S10. Using diverse error functions enhances the accuracy and understanding of isothermal models aligned with experimental results.
$$\:SSE={\sum\:}_{i=1}^{n}{\left(qe,calc\:-\:qe,meas\right)}_{i}^{2}$$
(12)
$$\:SAE=\sum\:_{i=1\:}^{n}{|qe,calc-\:qe,meas|}_{i}$$
(13)
$$\:ARE\frac{100}{n}\sum\:_{i=1}^{n}\:{\left|\:\right|\frac{qe,\:\:\:calc-\:qe,meas\:}{qe,meas}\:|}_{i}$$
(14)
Comparative analysis of MOF/ECPS versus other na++ adsorbents
A comparative analysis of Na + ion adsorption by various compounds is presented in Table 7.
MATP-40, developed by Xiong et al., exhibits a capacity to adsorb 21.8387 mg g − 1 of sodium ions (Na+) from bauxite residue.The application’s efficacy is significantly influenced by sodium ion residue, due to high alkali metal concentrations43. Shu et al. electrospun Dibenzo-18-crown-6 (DB18C6) into crown ether-functionalized polyacrylonitrile nanofibers. Altered nanofibers utilized as adsorbents for the adsorption of metal ions. The adsorption capacity for sodium ions in the 15 wt% DB18C6/PAN nanofibers was found to be at its highest at 11.9 mg g−144. Zeolites are classified as microporous aluminosilicates, featuring a highly intricate three-dimensional (3D) architecture that facilitates cation adsorption and exchange. Sazali et al. have successfully synthesized zeolite-A from kaolin.The synthesized zeolite-A demonstrated a maximum sodium ion adsorption capacity of 92 mg/g from seawater45. With its notable carbon content, biochar can be synthesized from diverse organic carbon materials, such as rice husk, straw, rubber wood, coffee husk, corn stalks, and coconut biomass via the pyrolysis method. Investigations by Nguyen et al. indicated that biochar sourced from rice husk demonstrated the most significant sodium adsorption capacity, measuring 33.9 mg g− 146. Ahmadzadeh Tofighy et al. synthesized and oxidized carbon nanotube (CNT) sheets for their potential in desalinating saline water.The study showed sodium ion adsorption was gradual, achieving a maximum capacity of 550 mg/g was observed after approximately 48 h at a concentration of 5000 ppm47. Four new developed MOFs/ECPS show superior sodium adsorption capabilities. Four newly developed MOFs/ECPS show superior sodium adsorption capabilities. MIL-125-NH2/ECPS adsorbed 529 mg Na+/g, while UIO-66-NH2-EDTA/ECPS achieved the highest capacity at 560 mg Na+/g.