Characterizations
The comparison of cow dung waste (CDW), acid-treated cow dung waste (ATCDW), and base-treated cow dung waste (BTCDW) underscores the significant impact of chemical treatment on key sorption properties, including surface area, pore volume, and pore size. The surface area increased from 62.4 m2/g for CDW to 85.5 m2/g for BTCDW, and further to 94.2 m2/g for ATCDW. A similar trend was observed in pore volume, with values rising from 0.35 cm2/g (CDW) to 0.44 cm2/g (BTCDW) and 0.62 cm2/g (ATCDW). These enhancements indicate improved porosity in the treated samples, which in turn boosts their adsorptive potential. Moreover, the average pore size of the chemically treated samples was larger than that of the raw CDW, suggesting that acid and base treatments induce structural modifications that increase accessibility for adsorbate molecules. TThe SEM images illustrates the morphological evolution of cow dung under various conditions, including before and after adsorption, as well as following acid and base treatments as shown in Fig. 2. In image (a), depicts raw cow dung before adsorption, the surface appears relatively smooth and compact, with embedded irregular particles. This structure indicates limited porosity and fewer active sites available for adsorption. After adsorption, as seen in image (b), the image shows a noticeable increase in surface irregularity, with fibrous and flake-like structures emerging. These changes indicate that the adsorbate has reacted with the adsorbent and likely altered the surface.
Figure 2c, which shows acid-treated cow dung before adsorption, shows a much more porous and fractured structure. The treatment seems to have removed some mineral or organic content, thereby increasing surface area and opening up the pores. Upon adsorption, image (d) reveals that some of the pores appear to be filled or blocked, indicating successful uptake of adsorbate. In image (e), which shows the base-treated cow dung before adsorption, fragmented and granular texture which is much distinct from both untreated and acid-treated samples were seen. This implies that the base treatment likely caused disintegration of structural components, thereby increasing the surface accessibility of the adsorbent. In image (f), that depicts the base-treated cow dung after adsorption, the surface appears denser, with signs of material deposition on the surface. This suggests that adsorption has occurred, with adsorbate occupying available pores on the surface. In all, the SEM images confirm that both acid and base treatments enhance the surface behaviour of cow dung material, making it more effective as an adsorbent. Acid treatment appears to have produce deeper crevices and well-defined porous structures, whereas base treatment results in a more fragmented and granular morphology.
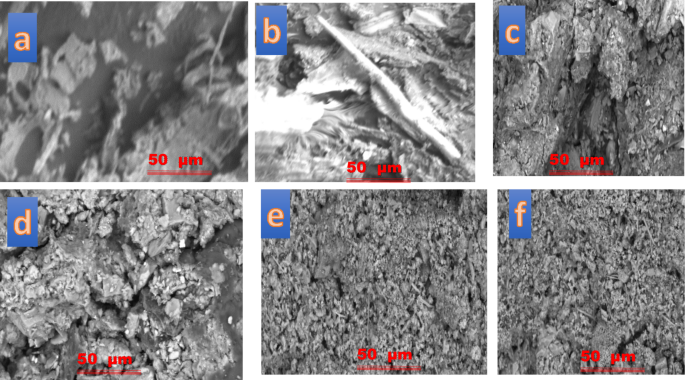
CDW images (a) before and (b) after the uptake of ARS.
FT-IR scan of cow dung waste before and after ARS dye adsorption was done and the results obtained are as provided in Fig. 3. The cow dung waste spectrum before adsorption, the observed peak at 3280.06 cm−1 is due to O–H stretching from cellulose and lignin, while the peaks at 2855.14 cm−1 and 2922.23 cm−1 are peculiar to C–H bands, typical of methylene and methyl groups in cellulose and hemicellulose29,30,31. The triple bond stretching from alkynes, C≡C or C≡N stretching, possibly from nitriles was seen at 2102.22 cm−1. The band at 1636.30 cm−1 is assigned to C=O bond in amides or C=C bond in alkenes, which could be linked to proteins (amide I band) or unsaturated fatty acids. The band at 1563.55 cm−1 relates to N–H bending (amide II) in proteins or aromatic ring vibrations. The peak at 1423.85 cm−1 arising from C–H bending (CH2), suggests the presence of fatty acids or lipids, while the peak at 1375.39 cm−1 represents C–H bending (CH3), indicating the presence of aliphatic hydrocarbons or methoxy groups in organic matter32,33,34. The band at 1319.59 cm−1 relates to C–N bond or O–H bending vibrations, often seen in amines or carboxylic acids, suggesting the presence of proteins or amino acids in the dung. The C–O stretching vibrations peak is seen at 1036.20 cm−1, which could arise from carbohydrates (cellulose, hemicellulose) or other organic substances like lignin32,33,34. The FT-IR spectrum reveals significant peaks related to carbohydrates (cellulose, hemicellulose), proteins, lipids, and possibly some organic acids. The existence of N–H, O–H, C–O, C–N, C=O, and C–H bonds reflects the complex mixture of biological materials in cow dung, including plant matter, proteins, and fats. The peaks also indicate the presence of fatty acids and water content, which are typical components of cow dung. The peaks related to N–H, O–H, C=O, C–O and aromatic rings suggest that the dye interacts with cow dung. For example, the peak observed at 3280.06 cm−1 shifted to 3198.06 cm−1, indicating interactions between the O–H or N–H groups in cow dung and the O–H groups of Alizarin Red S (ARS), likely through hydrogen bonding or chelate formation. The peak at 1997.85 cm−1 may represent overtone or combination bands of carbonyl or aromatic groups. Since ARS, an anthraquinone dye, contains C=O bonds and an aromatic system, this peak could result from interactions between cow dung and the dye, potentially from ARS’s carbonyl or aromatic overtones. The peak originally at 1636.30 cm−1 before interaction with ARS shifted to 1651.21 cm−1, which suggests interactions between cow dung’s organic components, such as proteins, and the dye’s carbonyl groups. The N–H bending (amide II) or aromatic ring vibrations observed at 1563.55 cm−1 shifted to 1558.03 cm−1, indicating possible interactions between ARS’s aromatic rings and proteins or aromatic compounds in cow dung. Similarly, the C–O stretching peak at 1036.20 cm−1 in cow dung before ARS adsorption shifted to 1006.38 cm−1 after adsorption, indicating structural changes in the carbohydrate of cow dung due to interaction with ARS molecules. The new band seen at 868.47 cm−1 relates to aromatic compounds C–H out-of-plane bending, especially in substituted benzenes or aromatic systems. This peak likely reflects interactions with aromatic or phenolic compounds in cow dung, possibly through π–π interactions, as ARS has an aromatic structure. Overall, the FT-IR spectrum also indicates that cow dung interacts with ARS mainly through hydrogen bonding and possible metal ion coordination.
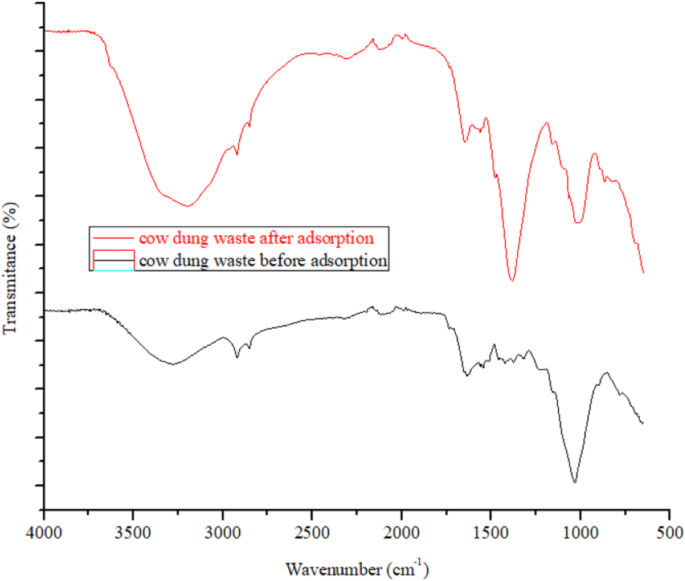
FT-IR of cow dung before and after adsorption of ARS.
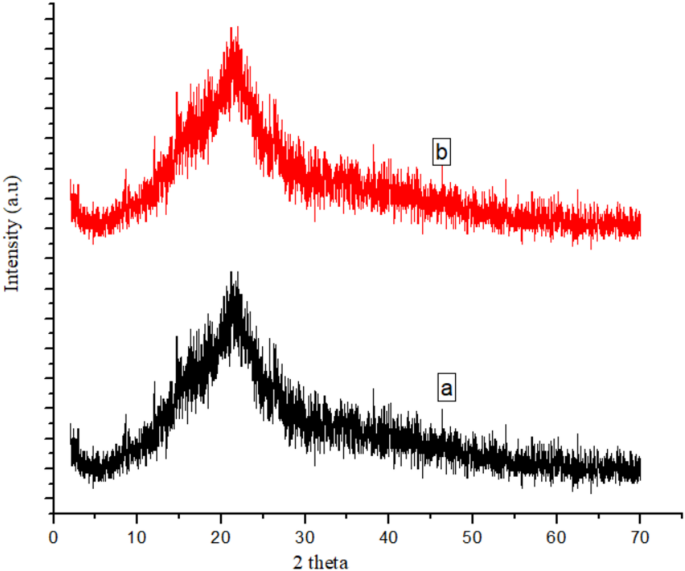
XRD of cow dung (a) before and (b) after adsorption of ARS.
The patterns of cow dung waste XRD before and after ARS uptake are shown in Fig. 4. The XRD pattern of cow dung before adsorption was observed at 21° which is associated with semi-crystalline structure of cellulose from undigested plant material since cellulose is a key structural component in plants, and cow dung typically contains partially digested or undigested plant fibers35. After the adsorption of ARS, no visible changes occurred suggesting that the adsorption of ARS by the cow dung adsorbents do not have any effect on the bulk crystalline structure of the adsorbent which could be attributed to the fact the uptake of the ARS molecules occurred on the surface of the adsorbent and not within the the internal crystal structure. The elemental composition of the cow dung is shown in Fig. 5 which revealed the presence of O (56.59%), Ti (2.11%), Na (24.81%) and C (16.49%).
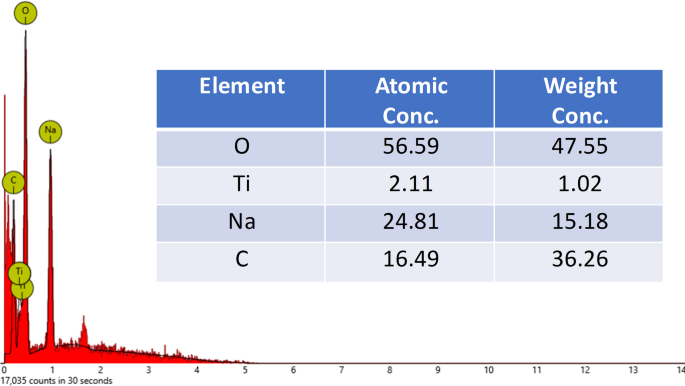
Elemental compositions of cow dung waste.
pH effect on the adsorption of ARS
The adsorbents’ adsorption capacity significantly influenced by the concentration of hydrogen ions in the solution. For this work, the pH of the ARS solution was varied from 2.0 to 6.0, as shown in Fig. 6. When the pH was fixed at 2.0, the capacity of adsorption for the three adsorbents tested was at its highest, with the acid-treated biomass demonstrating the most effective pollutant removal. The CDW, ATCDW, and BTCDW adsorption potency decreased from 67.82 to 54.32%, 86.45–65.33%, and 82.37–60.32%, respectively, on adjusting the pH of ARS from 2.0 to 6.0. The enhanced adsorption at lower pH values could be because of the protonation of the adsorbent’s receptive groups and the anionic nature of the ARS dye. It has been reported that these receptive groups are highly acidic, with negative pKa values, which allows for the uptake of the dye through the positively charged adsorbent surface at pH of 2.0, and facilitated by electrostatic attraction11,36. Experiment on zero-point charge (pHpzc) were conducted to further assess the impact of pH on the sorption process and the estimated values are 5.2, 4.2, and 5.6, for CDW, ATCDW, and BTCDW respectively. It is expected that at pH values lower than these pHpzc values, the cow dung waste surface will be positively charged5,36. At pH values lower than the pHpzc (5.2, 4.2, and 5.6 for CDW, ATCDW, and BTCDW), the adsorbent surfaces will be positively charged, enhancing electrostatic attraction between the positively charged adsorbent surface and the anionic ARS molecules, leading to higher adsorption efficiency. Conversely, as the pH increases (from 2.0 to 6.0), the adsorbent surface becomes less positively charged and eventually negatively charged (above the pHpzc), which weakens the electrostatic interaction with the negatively charged ARS molecules. This explains the decrease in adsorption capacity as the pH increases, as shown in the experimental results. At pH 6.0, the adsorbents’ surfaces are more negatively charged, and fewer electrostatic interactions occur between the adsorbent and the anionic ARS molecules, resulting in a significant reduction in adsorption. In the adsorption of of alizarin Red S biosorption by Alhagi maurorum as reported by Akram et al.37, it was observed that at acidic values of pH (3.0 to 6.0), the biosorbent surface is likely to positively charged, and that this enhance the interaction between the biosorbent and the ARS dye molecules that are negatively charged. However, with the pH rising above pH 6, the biosorbent surface became negative resulting into electrostatic repulsion between the biosorbent surface and ARS molecules, causing reduction in the removal percentage.
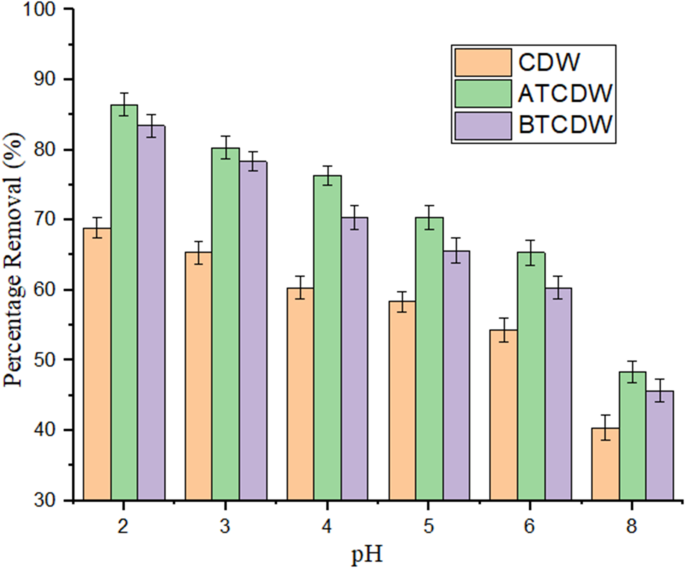
Role of pH on the uptake process of ARS by CDW, ATCDW and BTCDW.
Effect of adsorbent amount
The role played by the various adsorbents amount on ARS removal was studied. Figure 7 shows the plots of the various amount of the adsorbent on the eradication of ARS, with the removal efficiency increasing with the adsorbent dosage until equilibrium is reached. When CDW was used, the removal efficiency rose from 52.46 to 74.59% when the adsorbent amount rose from 0.1 to 0.7 g. However, when both acid- and base treated cow dung were used, there was a tremendous increase in the adsorption efficiency from 58.11 to 86.89% and from 55.27 to 80.38% respectively on adjusting the adsorbent amount from 0.1 to 0.5 g. It was noticed that for the raw cow dung, maximum adsorption was attained at adsorbent amount of 0.7 g, whereas, for both the acid- and base treated samples, maximum adsorption was attained at 0.5 g. This implies that aside the fact that the treated samples performed better than the raw samples, smaller amount of the treated samples are needed to reach equilibrium. The rise in adsorbed amount could be ascribed to increase in the number of available sites of adsorption sites thereby increasing the removal efficiency2,3. More active sites are provided for uptake of the pollutant with surge in the quantity of the adsorbent in solution, but a point is reached when saturation of these active sites occurs and as such, the removal rate declined as observed in this study when the adsorbent amount was above 0.5 g for treated sample and 0.7 g for the raw adsorbent2,3. The work done by Akram et al.37 found that when the dosage of biosorbent was increased, it resulted in a higher percentage of ARS removal and optimum quantity of biosorbent of 0.9 g was sufficient to achieved maximum adsorption a maximum removal percentage of 82.264%. This was attributed to available large surface area containing the receptor groups of the adsorbent.
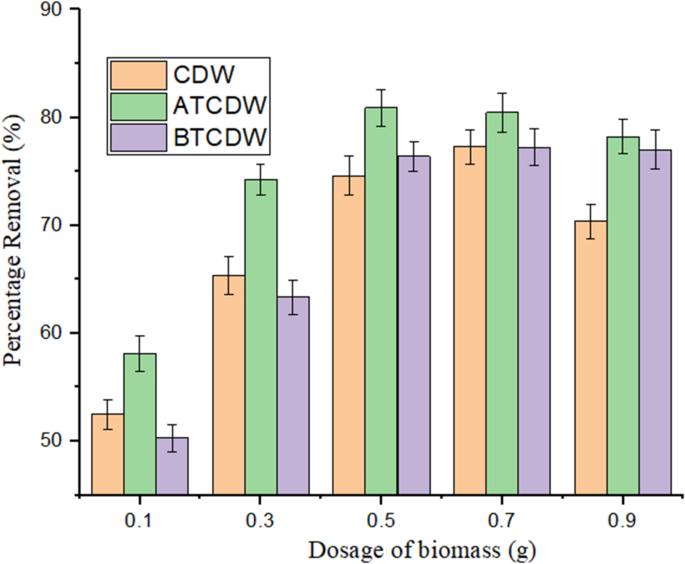
The role of biomass amount on the uptake of ARS by CDW, ATCDW and BTCDW.
Effects time of contact and initial pollutant concentrations
Figure 8 illustrates the role of shaking time and pollutant concentration on the uptake performance of the adsorbents. The capacity adsororption of the three tested adsorbents for Alizarin Red S (ARS) shows a significant surge at the beginning of the reaction, and then reduced as the reaction progresses, ultimately reaching an equilibrium state. The capacities of adsorption for CDW and ATCDW rose from 5.38 to 18.15 mg/g (Fig. 8a) and from 9.14 to 24.52 mg/g (Fig. 8c) by extending the contact time from 20 to 100 min at ARS concentration of 50 mg/L. In contrast, the capacity of BTCDW rose from 7.85 to 21.18 mg/g (Fig. 8b) as the shaking time was extended from 20 to 80 min at the same 50 mg/L of ARS. At a higher ARS value of 300 mg/L, the amount of ARS adsorbed by CDW and ATCDW increased from 19.58 to 56.82 mg/g and from 23.57 to 88.43 mg/g, when the contact time was adjusted from 20 to 100 min. Meanwhile, the sorption potency of BTCDW surged from 22.44 to 75.46 mg/g when the equilibrium time was extended from 20 to 80 min at 300 mg/L ARS concentration. The initial rise in adsorption capacity at the start of the reaction is ascribed to the availability of vacant receptors on the adsorbent’s surface, which facilitates the diffusion of ARS molecules. But when the reaction continues, the empty receptors were filled up, leading to a decrease in the reaction rate and a subsequent reduction in the adsorbent performance towards ARS uptake.
Nawaz et al.9 observed that the trend of adsorption percentage of ARS increases with the shaking time, reaching its maximum at 45 min for magnetic Dalbergia sissoo and 60 min for Dalbergia sissoo and thereafter declines. They opined further that at the start, the sorption rate was rapid as the dye molecules quickly adhered to the outer surface of the adsorbent, owing to the availability of vacant binding sites. Similarly, data by Akram et al.37 exhibited that the adsorption of ARS by adsorbent rose with greatly with an increase in contact time up to a stage, and thereafter became almost constant with equilibrium achieved after 30 min. Imamea et al.38 observed that the amount of dye adsorbed by biomass rose over time and attaining equilibrium at 50 min of contact time and this was because the adsorbent’s surface initially has active sites available for use. After this time (the equilibrium time), there is a decrease in adsorption efficiency because fewer free sites remain on the adsorbent’s surface.
In the study on the effect of pollutant concentration, it was noticed that as the ARS concentration rose, the capacity of adsorption equally rose up (Fig. 7). The capacity of adsorption CDW, ATCDW and BTCDW surged with the concentration of the pollutant. The rise in the capacity of adsorption by the adsorbents with increase in pollutant concentration is essential driving force to break way from the mass transfer resistance. With this driving force, more molecules of the pollutant are transported from the solution to the surface of the adsorbents, leading to higher ARS removal37,38,39. In the study conducted by Nawaz et al.9 on the influence of the initial ARS concentration on the removal percentage ARS by Dalbergia sissoo and magnetic Dalbergia sissoo show that the removal efficiency of ARS rose with an increases in the initial ARS concentration and an optimal value of 66.7% for DS and 97.89% for DSMNC when the other parameters are fixed.This increase in the ARS amount is due to an enhances the driving force for mass transfer, causing an increases in the amount of adsorbed ARS.
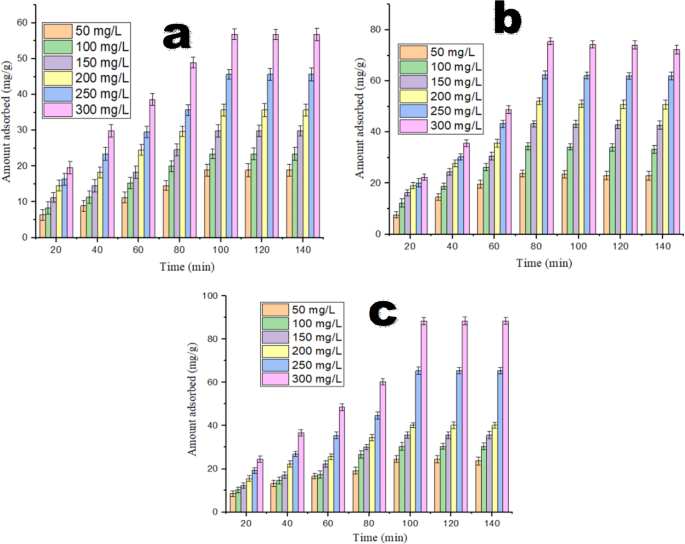
The role of shaking time and ARS concentration on the uptake process of ARS by (a) CDW, (b) BTCDW and (c) ATCDW.
Kinetics studies
The kinetics models of pseudo-first-order (PFO), pseudo-second-order (PSO), and intraparticle diffusion kinetics were used to fit the experimental data. The constants from these models were computed their linear forms as indicated in Fig. 9 and represented in Table 1. The adsorbed ARS amount at time t (mg g − 1) and the equilibrium adsorption capacity (mg g− 1) are given as Qt and Qe; where the rate constants from the PFO (min− 1) and PSO (g mg/min− 1) models are given as k1 and k2, while t denotes time (min). Where Ci is the intercept from the intraparticle diffusion model. The kinetics variables values obtained are as listed in Table 2. The results obtained using the CDW and ATCDW show that the correlation coefficients (R2) from the PSO model were greater when compared with those from the PFO kinetic model; besides, the calculated the Qe values of the PSO model were closer to those of experimental data. Furthermore, from the smaller values of the sum of error squares (SSE, %) computed for PSO, it can be said that the adsorption of ARS by CDW and ATCDW are governed by the PSO model and the adsorption process is controlled by chemical process2,3. The PFO model fits the data from the base treated cow dung waste on the strength of the higher values obtained from the correlation coefficients (R2) and the closeness of the computed Qe values with experimental data. This was corroborated from the smaller values of the sum of error squares (SSE, %), thus, suggesting that the rates of adsorption of ARS by BTCDW is controlled by physical process40,41.
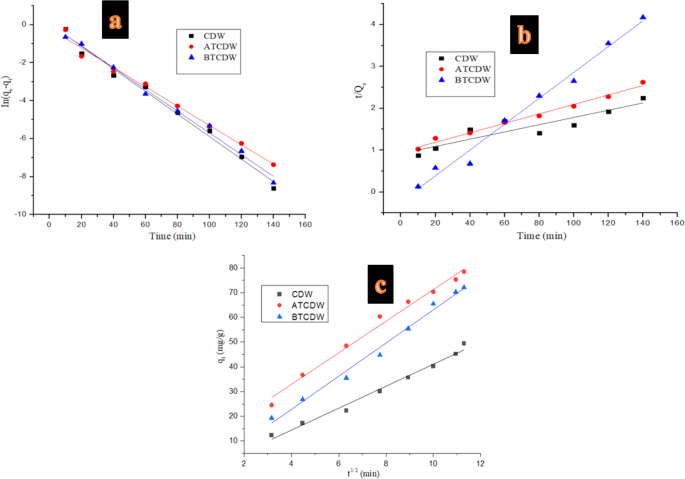
Kinetics of (a) PSF, (b) PSO and (c) intraparticle diffusion models for the uptake of ARS by CDW, BTCDW and ATCDW.
This observation was equally supported by the similarity observed between the computed and experimental Qe values the adsorption process and this imply that uptake of ARS by ATCDW is chemical process42,43,44. The intraparticle diffusion model plots are given in Fig. 9c which depict three regions of adsorption beginning with a sharp stage which is due to external instantaneous adsorption. The stage two is attributable to intraparticle diffusion which involves a gradual adsorption process, and the final step is the equilibrium stage involving the uptake of the dye molecules which is controlled by physical process2,40,42,43,44. It was observed that none of plots when through the origin, and this suggests that the rate-controlling step is not only governed by intraparticle diffusion model, and as such, the rate limiting process involves some other mechanisms2.
Adsorption isotherm
To further investigate the mechanism of Alizarin Red S adsorption by the various prepared adsorbents, mathematical models of pseudo-first order, pseudo-second order, and intra-particle diffusion kinetics and equilibrium isotherms of Langmuir, Temkin, Freundlich, and Dubinin-Radushkevich were employed using linear regression tool as listed in Table 1. where the ARS adsorbed amount at equilibrium (mg g− 1) and the adsorption maximum capacity (mg g− 1) are denoted as qe and qm respectively, the concentration at equilibrium (mg·L− 1) is given as Ce, the affinity between adsorbent and solute which defines Langmuir constants in L mg− 1 is represented as RL3:
$$\:{R}_{L}=\frac{1}{1+b{C}_{o}}$$
where the constant of Langmuir and initial ARS concentration are given as b and Co. The values of RL can be utilized to elucidate the type of the isotherm such as irreversible when RL = 0, but when 0 L L = 1 and becomes unfavorable when RL > 13. The sorption capacity of the Freundlich constants (mg g− 1) (L mg− 1) 1/n is denoted as KF, the sorption intensity of the Freundlich constants is given as n, the adsorption concentration (mg L− 1). From the D-R, the amount of pollutant adsorbed per weight unit of adsorbent after equilibrium (mol/g) is given as Qe, while qm denote adsorption maximum capacity (mol/g) of monolayer coverage, the mean sorption energy associated with activity coefficient mol2/kJ2 is depicted as KDR, the Polanyi potential constant is given as ε, R (8.3145 J mol− 1 K− 1) is ideal gas constant, and T stands for absolute temperature in K. Figures 10 and 11 show the isotherms plots, while Tables 1 and 3 presents the isotherms equations, their constants and the respective values obtained. On the basis of the coefficient correlation (R2), the CDW and ATCDW obey the Freundlich isotherm indicating a heterogenous adsorption process, whereas, the adsorption ARS by BTCDW follows Langmuir isotherm which implies monolayer adsorption and the adsorption performance of adsorbent surface is uniform42,43. The monolayer maximum capacities from the Langmuir isotherm for CDW, ATCDW and BTCDW are computed to be 58.241, 87.543 and 61.370 mg/g, respectively, with the ATCDW significantly higher than the remaining two adsorbents. The computed values of RL for the three adsorbents were found to be 0.720, 0.322 and 0.171 for CDW, ATCDW and BTCDW suggesting a favorable character toward ARS adsorption. The value of E is very important in predicting whether the adsorption occurred via physical or chemical process43,47,48. The adsorption of ARS by CDW and ATCDW can be chemical in nature since the calculated value of E is bigger than 8 kJ/mol but the adsorption by BTCDW is physical because the value of E computed is less than 8 kJ/mol43,44. Table 4 gives the different adsorption capacities of adsorbents in literature in comparison with those CDW, ATCDW and BTCDW adsorbents for the eradication of ARS. As can be seen, these three adsorbents compete favorably with others in literature which is a confirmation of their applicability in the ARS removal from contaminated water.
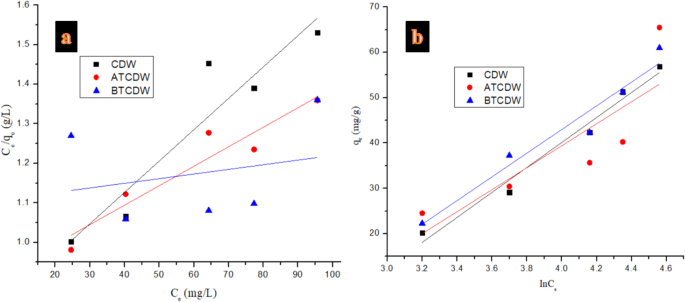
Isotherms of (a) Langmuir, and (b) Temkin in the adsorption of ARS by CDW, ATCDW, and BTCDW.
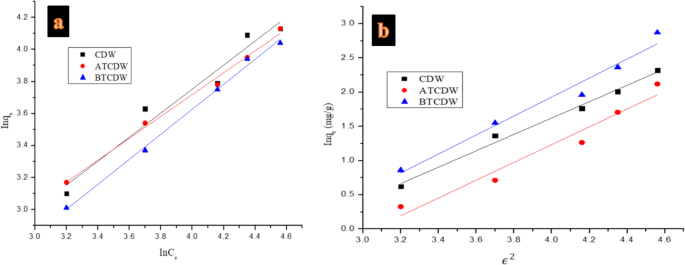
Isotherms of (a) Freundlich, and (b) D–R in the adsorption of ARS by CDW, ATCDW, and BTCDW.
Temperature effect and thermodynamics study
Temperature is very crucial factor for the uptake of pollutant by adsorbent and to evaluate if the adsorption of ARS is exothermic or endothermic, studies were done at varied temperatures (25–65 °C) as shown in Fig. 12a. The elimination of ARS surge with a rise in temperature, which suggests the nature of the process to be endothermic. When the adsorption process temperature was raised from 25 to 45 °C, the percentage adsorption of CDW, ATCDW and BTCDW increased from 52.36 to 70.33%, 51.68 to 74.65% and from 51.26 to 72.33% respectively. Maximum adsorption of ARS was attained at a temperature of 45 °C and above this temperature, the adsorption appeared to be uniform and as such, and for subsequent reactions, a temperature of 45 °C was chosen. When the temperature increases, solvent (water) and solid surface interaction reduces which expose larger proportions of the adsorption sites for the uptake of the dye molecules36,41. With this, the interaction between adsorbents and dye molecules increases. However, at a much higher temperature, the possibility of bond rapture, could be responsible for the declined in the sorption ability of the adsorbent36. Thermodynamics parameters of enthalpy change (ΔH), entropy change (ΔS), and free energy change (ΔG) were determined using Eq. 12 to 14 below5,40:
$$\Delta G^{o} = – RT\ln K_{D}$$
(12)
$$\Delta G^{o} = \Delta H^{o} – T\Delta S$$
(13)
$$\:In{k}_{D}=\frac{\varDelta\:S}{R}-\frac{\varDelta\:H}{R}\times\:\frac{1}{T}$$
(14)
where KD denote the equilibrium constant which was obtained from the graph of (qe/Ce) against qe, R which is valued at 8.314 J K−1 mol−1 denote the universal gas constant, and T represents temperature in Kelvin. The values of ΔH and ΔS were determined the slope and intercept from the plot of ln Ko against the inverse of the temperature (1/T), as illustrated in Fig. 12b. As revealed in Table 5, the ΔH values indicate that the elimination process of ARS by CDW and ATCDW could be considered as endothermic and chemical adsorption in nature (ΔH is greater than 40 kJ mol− 1), whereas that of BTCDW physical in nature (ΔH is less than 20 kJ mol− 1)8,48. In a similar way, judging on negative values of ΔG, the elimination process of ARS by the three adsorbents is spontaneous and feasible with better preference of ARS particles for the adsorbents. The negative values of ΔG were observed to increase with rising temperature, further confirming the endothermic nature of sorption process. The entropy changes values obtained for CDW, ATCDW and BTCDW are 3.71, 1.35 and 2.46 kJ mol− 1 K− 1 respectively and since the values are positive, it inferred an increase in randomness of the uptake process and reflects the affinity of the adsorbents for the ARS molecules at elevated temperature5,41.
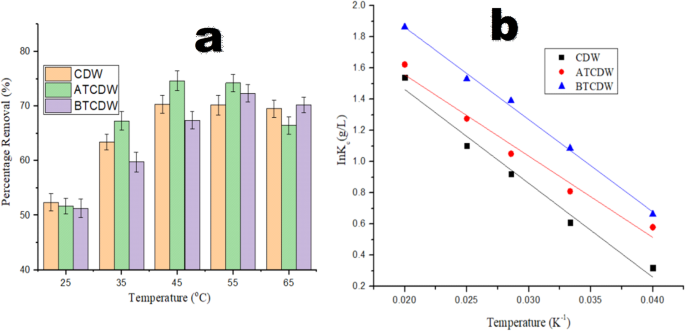
Plots of (a) temperature effect and (b) thermodynamics study in the adsorption of ARS by CDW, ATCDW, and BTCDW.
Mechanism of adsorption
The relationship between the ARS molecules and the adsorbent can be further understood through adsorption mechanism. As seen from the infrared spectra of adsorbents, the surface of the adsorbent was composed of functional groups like O–H, C=O, and C–O which when submerged in a solution with pH less than 4.0, they become protonated, and the CDW surface acquires a positive charge. On the hand, the ARS molecules are negatively charged due to its’ anionic nature. Thus, an electrostatic bond is formed between the ARS particles which are negatively charged and the positively charged CDW functional groups that have been protonated and as such, the mechanism of ARS dye uptake by the cow dung waste could be an electrostatic interaction. This view was supported in literature by the study conducted by Fernando et al.5. where it was stated that the uptake of anionic dye (ARS) by carbon nanotubes at pH 2 occurred via electrostatic attraction of the positively charged carbon nanotube and the negatively charged anionic molecules of ARS. Judging from thermodynamic study as based on the values of ΔH, the mechanism of ARS adsorption by CDW and ATCDW proceed through chemical adsorption since ΔH is between 80 and 450 kJ mol−1, whereas the mechanisms of BTCDW is physical in nature with ΔH value less than 20 kJ mol-15,23,40,48.
Desorption overview
The desorption data for CDW, BTCDW, and ACTCDW are revealed in Fig. 13. For raw cow dung, desorption decreases steadily from 76.7 to 52.3% as the number of desorption study declines from cycle one to six, suggesting that raw dung’s ability to release adsorbed substances declines gradually, though this trend was little within the first three cycles. This suggests that untreated cow dung is less effective at retaining adsorbed compounds, potentially due to a less-developed surface structure or chemical interactions that might otherwise enhance retention. For the base-treated cow dung sample on the other hand, similar trend was seen, but the desorption values are higher, decreasing from 82.3% at first cycle to 68.9% at sixth cycles. This indicates that base treatment modifies the surface of the cow dung material such that it improves its ability to retain adsorbed ARS molecules when compared to the raw sample. In the case of the acid-treated cow dung, it consistently shows the highest desorption values, ranging from 85.4% at first cycle to 70.2% at sixth cycles. This could be as a result of the acid treatment which altered the surface charge of the dung, and enhanced its ability to retain adsorbed ARS molecules. Comparing the three materials, the acid treatment appears to have more retention ability towards the adsorbed molecules of ARS, with consistently higher desorption values across all measurements. This could be due to the increased surface area, altered surface chemistry, and possibly the breakdown of organic matter.
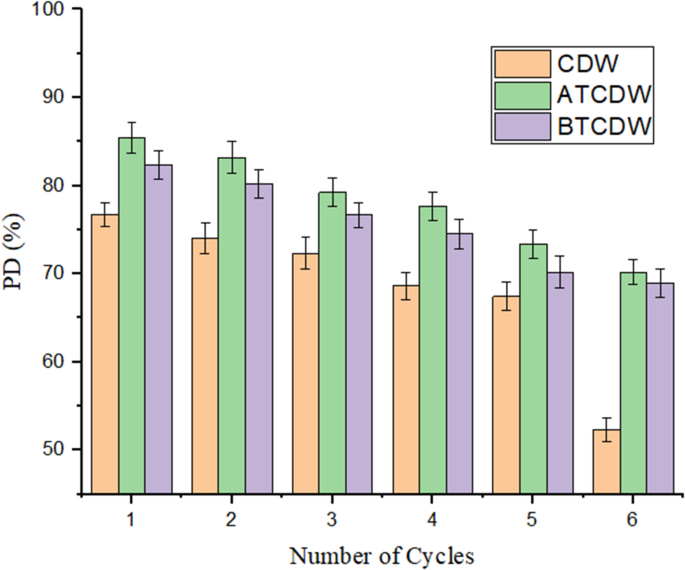
Potential contamination from untreated cow dung waste (CDW) and future considerations
One important consideration in this study is the potential risk of contamination when using untreated cow dung waste (CDW) in environmental processes. Untreated CDW may contribute to pollution, introducing bacteria, heavy metals, and other pollutants that are not digested by cows, such as microplastics and other chemical residues. In our experimental setup, we have made efforts to minimize the risk of contamination. Prior to any treatments, the cow dung was thoroughly washed to remove any easily removable external contaminants and sun dried. The growth of microbs was also hindered by adopting acidic pH range. However, we recognize that further analysis of potential microbial presence, as well as the identification of heavy metals and microplastic contamination, would strengthen the environmental safety aspects of the study. Thus, a more thorough assessment of the impact of untreated CDW on distilled water could be a future studies to ensure a complete evaluation of the material’s environmental impact.


3 Comments
bm0svj
https://shorturl.fm/vDYOb
m85epy