Close Menu
bkngpnarnaul
  • Home
  • Education
    • Biology
    • Chemistry
    • Math
    • Physics
    • Science
    • Teacher
  • E-Learning
    • Educational Technology
  • Health Education
    • Special Education
  • Higher Education
  • IELTS
  • Language Learning
  • Study Abroad

Subscribe to Updates

Please enable JavaScript in your browser to complete this form.
Loading
What's Hot

K-12 Gamification: A Guide For Publishers

September 23, 2025

Can Plantar Fasciitis Cause Knee Pain? Know the Link

September 23, 2025

The Purpose of a Classroom Observation for Gathering Data

September 23, 2025
Facebook X (Twitter) Instagram
Tuesday, September 23
Facebook X (Twitter) Instagram Pinterest Vimeo
bkngpnarnaul
  • Home
  • Education
    • Biology
    • Chemistry
    • Math
    • Physics
    • Science
    • Teacher
  • E-Learning
    • Educational Technology
  • Health Education
    • Special Education
  • Higher Education
  • IELTS
  • Language Learning
  • Study Abroad
bkngpnarnaul
Home»Biology»Visualizing with Vibes: Potential and Pitfalls
Biology

Visualizing with Vibes: Potential and Pitfalls

adminBy adminJune 3, 2025No Comments4 Mins Read5 Views
Share Facebook Twitter Pinterest LinkedIn Tumblr Email WhatsApp Copy Link
Follow Us
Google News Flipboard Threads
Visualizing with Vibes: Potential and Pitfalls
Share
Facebook Twitter LinkedIn Pinterest Email Copy Link


Anyone—regardless of coding skills—should be able to generate a publication-quality plot of their data in minutes. That was the main motivation to develop a series of web apps to make state-of-the-art data visualization more accessible (huygens.science.uva.nl). But who cares, the same result can be achieved with generative AI (genAI) based tools, right?

Before discussing what genAI can bring us for coding a plot, I briefly explain how the web apps work, so we can compare it with genAI later on. The data visualisation produced by the web app (the output) is coded in R and uses the {ggplot2} package. Another R-package, {shiny}, is used to create a graphical user interface (GUI). This GUI enables the user to optimize the data visualization by modifying the (invisible) code, through sliders, buttons, drop-down menus, and text fields. The process of creating a data visualization in a web app is highly interactive. By using a web app, the user can focus on what the data visualization should look like, without dealing with the code.

A screenshot of the web app SuperPlotsOfData. Users can optimize the data visualization with sliders, buttons, drop-down menus, and text fields.

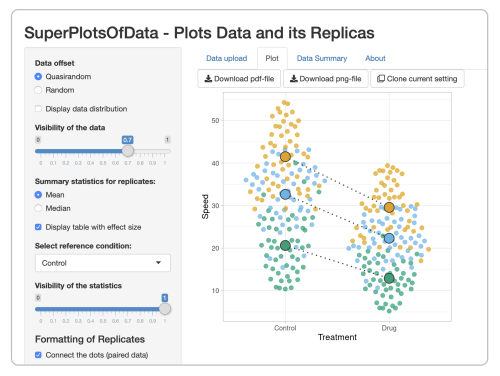
By design, the web apps are somewhat limited in their options, so I started an online resource with dataViz protocols as well. My hope was that this resource would lower the barrier for people that wanted more control than what is possible in the web app and therefore would be motivated to learn R&ggplot2. But now, there is genAI. Coding can be done, rapidly and interactively, with websites that spit out code based on Large Language Models. Instead of focusing on the code and the technicalities that are required to build a data visualization, the user can focus on what the data visualization should look like (do you see the parallels with web apps?). This approach is aptly called vibe coding.

One of the prompts that was used in ChatGPT for vibe coding the data visualization of the output of a 96-wells plate that is shown below.

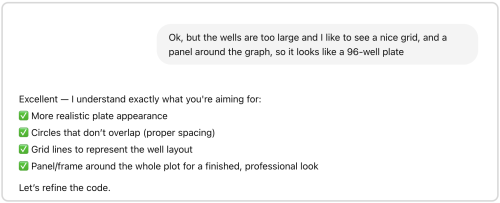
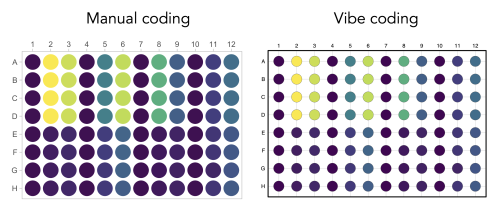
In a previous blog, I described that vibe coding “felt like I gained some kind of superpower”. But not everything is hunky-dory. It has been nicely documented by Mine Çetinkaya-Rundel that the AI-tool, besides the required changes, makes changes that are not explained and may be difficult to understand. I had exactly the same experience when I tried to vibe code a data valisualization that I had previously manually crafted (protocol 8 in the dataViz protocols book). In the end, the result (see below) is pretty neat, but it took several iterations (prompts), including some debugging of errors. I also noticed that understanding some of the basics (loading packages, knowing where to place the input data, how a plot is built using the {ggplot2} package) is needed to get the code to work. Worse yet, if the code seems to work but actually makes mistakes that are hard to spot things can go really wrong. For instance when doing some calculation for statistics that are difficult to understand or verify.

Graphical representation of readings from a 96-wells plate. The data visualization on the left was manually coded as detailed here and the data visualization on the right was generated by vibe coding in ChatGPT.

Are web apps still relevant when the same result can be obtained with vibe coding? Both the web apps and the genAI tools can be considered as a black box and allow the use to focus on the output. The genAI based tools offer great flexibility, but a strong point of the web apps is their predictable outcome, delivering a fully reproducible data visualization. The underlying code is available and the web apps are documented in (peer-reviewed) papers that can be cited. A practical advantage of web apps is that there is no need to install software or specific packages to run them. So I think there is still a future for the web apps. At the same time, I encourage experimenting with genAI as vibe coding offers new and exciting opportunities for data analysis and visualization. This will require at least a basic understanding of the coding language and sanity checks. Altogether, these are exciting times as the options for generating publication-quality data visualizations are expanding!

Thumbs up (1 votes)
Loading…


Source link

Pitfalls Potential Vibes Visualizing
Share. Facebook Twitter Pinterest LinkedIn Tumblr Email WhatsApp Copy Link
yhhifa9
admin
  • Website

Related Posts

Biology

Bringing Affordable VEGF Gene Therapy to Medical Tourism Clinics – Fight Aging!

September 21, 2025
Biology

mRNA vs DNA transient transfection

September 20, 2025
Biology

August in preprints

September 19, 2025
Biology

Treating Aging as the Cure for the Pharmaceutical Industry’s Financial Woes – Fight Aging!

September 16, 2025
Biology

Catch up on Development presents… webinar on gene regulation

September 12, 2025
Biology

Explore Enzymes with Hydrogen Peroxide and Liver

September 11, 2025
Add A Comment
Leave A Reply Cancel Reply

Top Posts

2024 in math puzzles. – Math with Bad Drawings

July 22, 202521 Views

Testing Quantum Theory in Curved Spacetime

July 22, 202514 Views

How AI Is Helping Customer Support Teams Avoid Burnout

May 28, 202510 Views

Chemistry in the sunshine – in C&EN

August 9, 20258 Views
Don't Miss

Can I Use Financial Aid for a Study Abroad Program?

By adminSeptember 23, 20250

248 Are you wondering how to pay for study abroad? You’re not alone! Cost concerns…

What I Wish I Knew Before Starting University | Study in Ireland

September 22, 2025

Meet Four College Students Who Studied Abroad in England

September 19, 2025

Literary Gardens – Global Studies Blog

September 16, 2025
Stay In Touch
  • Facebook
  • Twitter
  • Pinterest
  • Instagram
  • YouTube
  • Vimeo

Subscribe to Updates

Please enable JavaScript in your browser to complete this form.
Loading
About Us
About Us

Welcome to Bkngpnarnaul. At Bkngpnarnaul, we are committed to shaping the future of technical education in Haryana. As a premier government institution, our mission is to empower students with the knowledge, skills, and practical experience needed to thrive in today’s competitive and ever-evolving technological landscape.

Our Picks

K-12 Gamification: A Guide For Publishers

September 23, 2025

Can Plantar Fasciitis Cause Knee Pain? Know the Link

September 23, 2025

Subscribe to Updates

Please enable JavaScript in your browser to complete this form.
Loading
Copyright© 2025 Bkngpnarnaul All Rights Reserved.
  • About Us
  • Contact Us
  • Disclaimer
  • Privacy Policy
  • Terms and Conditions

Type above and press Enter to search. Press Esc to cancel.