

Release study evaluation
The study was conducted to investigate the kinetics of MB release from MC, C980 and AV hydrogels both in the absence and presence of native and citric acid-modified starch. Figure 5 illustrates the percentage of MB released after 4 h.

Release percentage of MB from hydrogels after 240 min, 37 ± 0.5 °C, n = 4.
The graph showed the highest values of MB release in the case of hydrogels based on methylcellulose (MC). The hydrogel MC-based containing additional native starch exhibited a slight increase of released MB compable to the reference hydrogel without starch. The addition of modified starch to this hydrogel resulted in a reduction of the released MB by 10% for CS/2.5/120 and by 40% for CS/10/120. Hydrogels based on polyacrylic acid polymers (C980 and AV) showed a decrease in MB release compared to the hydrogel composed of MC. Comparing the values of MB release from hydrogels C980-based and AV-based containing starch to those of reference hydrogels without starch, a slight decrease in MB release was observed, in the following order: native starch (NS), followed by CS/2.5/120 and CS/10/120. NS has hydroxide groups which could have react with amine groups of MB. Citrate starches could bind MB due to additional carboxylic groups. The stronger binding MB by CS/10/120 than by CS/2.5/120 depended on greater amount of citric acid added during the CS/10/120 synthesis. The addition of CS/10/120 to the MC-based hydrogel had the most significant effect on slowing down the MB release, as CS/10/120 could react most strongly with MB. At the same time, the value of released MB was still higher than for hydrogels based on polyacrylic acid polymers, as the MC polymer (Fig. 1a) lacks functional groups that could interact with the amine groups of MB (Fig. 2b). In the case of C980 (Fig. 1b), the carboxyl groups of this polymer may have reacted with the amine groups of MB. Similarly, the carboxyl groups of AV (Fig. 1c) could have interacted with MB. The interactions of hydrogel polymers with methylene blue (MB) were stronger than those of starch with MB, as evidenced by the amounts of MB released. This difference can be attributed to the order of addition of the formulation components and their mixing with methylene blue. Initially, MB was mixed with the hydrogel, and after 24 h of storage under refrigeration, starch was added. It cannot be excluded that there might have been dependencies between starches and methylene blue (MB) other than chemical interactions. This is supported by the uneven release profile observed in the case of hydrogels composed of methylcellulose (MC). Excluding the interactions between MC and MB, only the interactions between starches and MB remained. Differences in the MB release profile from MC-based hydrogels may be attributed to the structural properties of the starches.
The obtained results of the time-released MB were fitted to the wave function according to kinetic models (Fig. 6).

MB release plot from hydrogels as: MC (red marks), C980 (green marks) and AV (blue marks), according to kinetic models: zero-order (a), 1st-order (b), 2nd-order (c), Higuchi (d), Korsmeyer–Peppas (e) and Weibull (f). The starch content is marked accordingly: open circle lack of the starch, closed circle native starch, closed square CS/2.5/120 and closed triangle CS/10/120, n = 4.
Straight lines derived from linear regression for a series of points from the test results were marked. The course of MB release from MC hydrogels showed the greatest deviation from the zero-order model (Fig. 6a). For the Korsmeyer–Peppas model, test results up to 60% of the amount of MB released were included (Fig. 6e). Table 3 shows the parameter values and determination coefficients (r2) of the kinetic models.
The release profile of MB in the given formulations was fitted to kinetic models based on the determination coefficient (r2) values. The lowest r2 values were observed for the zero-order model in most formulations. Formulations containing MC exhibited the highest r2 values for the Korsmeyer–Peppas, second-order and Higuchi models. Hydrogels with C980 and AV showed the highest r2 values for the second- and first-order kinetic models, as well as for the Korsmeyer–Peppas model. The rate constant values for the Korsmeyer–Peppas (KKP) model ranged from 0.019 to 0.095 for MC-based hydrogels, 0.003 to 0.051 for C980-based formulations and 0.003 to 0.044 for AV-based formulations. The rate constants for the second-order kinetics (KII) ranged from 0.0018 to 0.0118 h− 1%−1, 0.0007 to 0.0012 h− 1%−1 and 0.0005 to 0.0008 h− 1%−1 for hydrogels of MC, C980 and AV, respectively.
The zero-order kinetic model refers to the case when the dissolved form of the drug does not aggregate, its surface area does not change, and equilibrium is not reached. The zero-order half-time depends proportionally on initial concentration of the drug (Table 2). This type of model usually reflects the prolonged release process25. The first-order kinetic model shows the relationship between particulate dissolution and surface interaction26. The first-order half-time is concentration independent. The second-order model shows a release with a more complex mechanism, depending not only on the concentration of the active substance. The second-order half-life is inversely proportional to the initial concentration of the drug (Table 2). The Higuchi model is often applied to the release of water-soluble and poorly water-soluble drugs contained in semi-solid and/or solid matrices. It applies to 100% and less than 100% drug release27. The Korsmeyer–Peppas (K–P) model is typically used when releasing a drug in a controlled manner over an extended period of time in an expandable polymer matrix28. It refers to its release of up to 60% of the drug content29,30. A statistical Weibull model gives opportunity to compare the release mechanism according to a shape parameter25,31.
The release of MB from the MC-based hydrogel deviated most from the zero-order model. For the formulations without starch and those containing native starch (NS) or low-substituted starch (CS/2.5/120), the release pattern matched the K–P model, followed by second-order kinetics. However, the fit to the K–P model applied only to the MB released at the midpoint of the release time during the initial phase of the process (Fig. 6e). The high fit to the second-order model, and consequently the greater complexity of the release process, may indicate a higher instability of systems containing NS and CS/2.5/120 compared to those containing CS/10/120. In contrast, for the hydrogels containing highly substituted starch (CS/10/120), the release behavior was better described by the Higuchi model (Table 3). The results of MC formulation may be compared to our previous study of the release of lidocaine hydrochloride from MC in the presence of CS, where the majority of formulations showed the highest r2 values for the Higuchi model. The slight effect of the presence of CS on release by Fickian diffusion was indicated32. The study of β-escin release from MC formulation doped with acetylated starch showed the best adaptation to Higuchi and second-order kinetic models. It was mentioned that with respect to the second-order kinetic model two dynamic factors influenced the release33. Aside from the fact that the Korsmeyer–Peppas model applied only to the release of MB during at most two-thirds of the total release time (Fig. 6e), the present study demonstrated K-P model matching in the mostly formulations (Table 3). It is worth to exhibit that the n parameter is the release exponent that indicates the release rate mechanism. The n ≤ 0.43 concerns the Fickian diffusion (case I diffusion). The n between 0.43 and 0.85 indicates non-Fickian release. The n between 0.85 and 1.0 belongs to zero-order model (case II transport) and n > 1.0 reflects a super case II transport34,35. In the case of our study, the hydrogels C980-based and AV-based containing CS/10/120 showed n above 1.0, suggesting the occurrence of super case II transport with swelling and polymer chain relaxation, which might be attributed to interactions between CS/10/120 and other hydrogel components. The values of the n parameter for the other formulations ranged between 0.43 and 0.85, indicating that MB release from them followed a mechanism deviating from Fickian diffusion with combination of diffusion and erosion drug. The Weibull model as a statistical distribution of logarithmic release quantity variables over time relates to the progression of the entire release process until a plateau is reached (Fig. 6f). The key information regarding the reaction mechanism can be derived based on the shape parameter (β) of the Weibull model. Fickian diffusion is estimated for processes with β ≤ 0.75. The β between 0.75 and 1.0 means the Fickian diffusion combination with case II transport. For β value more than 1.0, the super case II transport of drug has been reported31,36,37. In our study only hydrogels with MC-based without starch and with NS had β parameter below 1.0 (Table 3). The highest β values belonged to the hydrogels C980-based doped with CS/10/120 and to the hydrogels AV-based hydrogels. The concordance of the parameter values of both Korsmeyer–Peppas and Weibull models applied only to the hydrogel C980-based and AV-based containing highly substituted starch CS/10/120.
pH measurement
The statistically significant difference was observed between pH data of tested hydrogel formulations, with the exception of relationship between G-MC4 and G-AV4, according to ANOVA test with p 7).

Determined average pH values of hydrogels, 25 ± 2 °C, n = 3.
The pH values of the tested hydrogel formulations varied significantly from one another. The pH of formulations containing native and modified starch were compared. The incorporation of native starch resulted in an increase in pH, while the inclusion of modified starches led to a decrease in pH (Fig. 7). Additionally, the reference hydrogels exhibited distinct pH values, with hydrogels C980-based showing the highest pH values. This may suggest the citrate starches decrease the pH due to the number of carboxyl groups substituted to the starch; the higher the degree of substitution, the lower the pH. However, may this indicate interactions between methylene blue (MB) and the substrate components of hydrogels influenced the pH? Our previous studies on MB adsorption indicated an increase in pH following the adsorption of MB onto citrate starch (CS), suggesting possible binding of the cationic MB groups to the carboxyl groups of CS38. The present study concerned hydrogel formulations did not exhibit increasing but pH decreasing following CS addition, indicating no reaction between MB and CS. Therefore, a notable effect of hydrophilic polymers on starch-MB interactions was observed. The method used for preparing the hydrogel formulations appears to be significant. In this process, an MB solution was initially added to the hydrogel, followed by the introduction of a starch suspension. The highest increase in pH (1.48 units) after the addition of native starch (NS) was observed for the MC hydrogel (G-MC2), whereas the lowest increase (0.5 units) was recorded for the C980 hydrogel (G-C9802). The addition of CS/2.5/120 resulted in pH decreases of 0.13, 0.24, and 0.07 for G-MC1, G-C9801, and G-AV1, respectively, while the addition of CS/10/120 decreased pH by 0.80, 1.15, and 0.87, respectively, for G-MC1, G-C9801, and G-AV1 (Fig. 7). The pH of the aqueous MB solution is acidic (pH 2.0–3.5)39. Only the addition of NS could cause an increase in pH, with the pH of the NS suspension being slightly alkaline (pH 7.0–7.5)38,40. The highest increase in pH after adding NS to MC-based hydrogel with MB suggests minimal or no interaction between the MC and MB groups, as free MB may be alkalized by NS. In contrast, the smaller increase in pH for the formulations with C980 and AV following NS addition points to an apparent interaction C980-MB and AV-MB, as a bound MB with C980 and AV could not react with NS. The addition of CS to each hydrogel did not result in significant differences in pH reduction, which prevents determining any distinct differences in interactions between CS and the hydrogel polymers.
The observed decrease in pH following the addition of CS to the hydrogel is proportional to the amount of carboxyl groups substituted by citric acid. Formulations containing CS/10/120 exhibited greater acidity compared to those with CS/2.5/120, which is most likely linked to the degree of substitution of starch with citric acid. The relationship between the degree of substitution and the amount of citric acid used was demonstrated by E. Zdybel et al. in potato starch esterification with mixture of: citric, ketoglutaric and pyruvic acids roasted at 120, 130, 140 and 150 °C41 Klaushofer et al. in the ‘dry’ esterification of starch via roasting42, by Ye et al. in the ‘dry’ esterification of starch via extrusion43, and by Agboola et al. in the modification of starch via ‘wet’ esterification44. In each of these methods of producing starch citrate, an increase in the degree of substitution of carboxyl groups was observed with an increase in the amount of citric acid added.
ATR-FTIR analysis
To assess the possible interactions between the hydrogels and MB, as well as between the starches and MB, infrared spectra were recorded (Fig. 8).
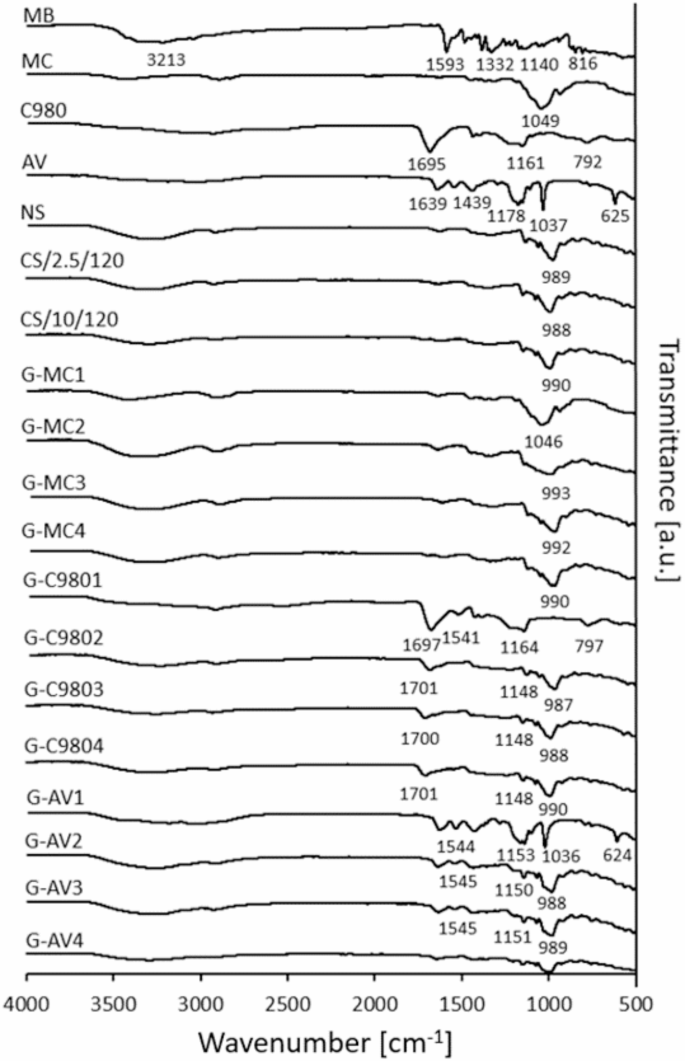
ATR-FTIR spectogram of the raw substances and hydrogels.
A comparison of the ATR-FTIR spectra of hydrogels with the corresponding substances revealed the presence or absence of peaks of the functional groups. Peaks in the range of 3350 and 3200 cm−1, corresponding to vibrations originating from both amine N–H and hydroxyl bonds O–H45, were observed in the spectra of MB, starches and every hydrogels, assuming the MB or starch occurrence in the hydrogels. In the case of MB, the peak at 1593 cm−1 may be attributed to C=N absorption46. The sharp peaks in the range of 1390 and 1332 cm−1, corresponding to the stretching vibration of the –CH2 and –CH3 groups were visible in MB46. However, a peak at 1390 cm− 1 could be attributed to C–N vibration47, as well. The peaks between 1449 and 1369 cm− 1 in the spectra of MC as well as in the hydrogel containing MC without the starch, were associated with the vibration of deformation out in the plane of C–H groups48. The peaks of C–N absorption at around 1140 cm−1 were observed in MB spectrum49. The peaks at around 1150 cm− 1 found in the spectra of every starches, C980- and AV-based hydrogels containing starches, might be attributed to the vibration of C–O of ether bonding50. The peaks at 855 and 816 were assumed as characteristic out of plane vibrations of C–H in the ring46.
The analysis of peaks observed in the FTIR spectra of pure hydrophilic polymers and their comparison with the spectra of the hydrogels filled with MB, with starches, or without them, helped to reveal the interactions occurring between the studied substances. The spectrum of MC displayed a prominent peak at 1049 cm−1, attributed to the stretching vibration of C–O–C bonds51. A similar peak at 1046 cm−1 was observed in the spectrum of a starch-free MC-based hydrogel. The spectra of hydrogels containing MC, C980, and AV polymers with starches exhibited peaks around 990 cm−1, attributed to the C–O stretching vibrations in alcohols50, indicating interactions between the starch and hydrophilic polymers. The highly visible peaks in pure C980 and AV at 1695 and 1639 cm− 1, respectively, were assigned to the C=O stretching vibrations45. Similar a peak at 1718 cm− 1 in pure CS/10/120 was seen, indicating the presence of C=O absorption in the molecule. A peak at 792 cm−1 in the spectrum of C980 indicated the absorption of C–H252. This peak was visible in the spectrum of starch-free C980-based hydrogel. In the spectra of C980-based hydrogels containing starch, no such peak was observed, which may point to the interaction between starch and the C980 polymer. Similarly, only the spectrum of the AV-based hydrogel without starch exhibited a peak at 624 cm−1, attributed to the vibrations from the C–S bond present in the structure of the AV polymer53. This peak was not observed in the spectra of AV hydrogels containing starch, indicating the interaction between starch and the AV polymer.
The analysis of interactions with MB and hydrophilic polymers as well as with the starches was based on the N+-COO− interaction between MB and polyacrylic acid polymers (C980 and AV) and between MB and CS. The possible interaction between MB and NS could assumed to N+–O− connection.
Spectrograms of the pure hydrophilic polymers provided a background for hydrogels additionally containing MB. In contrast, spectrograms of the hydrogels containing in addition the starch, had the starches’ spectrogram as a background. The differences between them were exhibited.
In the case of MC-based hydrogels the changes were assigned to the intensity increasing of the –OH absorption at 3395 and 1636 cm− 1 (G-MC1), as well as of C–H absorption at 2915, 2923, 2918 cm− 154 for G-MC2, G-MC3 and G-MC4, respectively. Moreover in the starch contained hydrogels the shifts were reported. The peaks assigned to C–O vibration at 1147 and 1051 cm− 1 were moved to 1129 and 1059 cm− 1 for G-MC2, to 1117 and 1062 cm− 1 for G-MC3 and to 1116 and 1055 cm− 1 for G-MC4. The examples of the hydrogels MC-based with the starches may be attributed to increasing of C–H groups from MB introduction, as well as to the interaction between –OH or –COOH groups of the starches origin and amine group of MB.
The hydrogels C980-based spectra comparison exhibited additional peaks attributed to MB appearance (Fig. 9a). The absorption of C=N at 1541, 1540, 1541 and 1545 cm− 146 appeared in the hydrogels as following: G-C9801, G-C9802, G-C9803 and G-C9804, respectively. This attributed to interaction between C980 and MB for G-C9801 as well as between starches and MB for the C980-based hydrogels with starches. Additional peaks at 1701, 1700, 1701 cm− 1 for the C=O absorption54, pointed to the interaction between C980 and the starches.
In the case of AV-based hydrogels without the starch (G-AV1), the spectrum changes were assigned to the intensity increasing of the absorption of –NH or –OH at the range from 3420 to 3050 cm− 154,55, indicating the interaction between AV and MB. The spectra of the hydrogels AV-based containing the starches exhibited additional peaks of C=N absorption at 1546, 1545 and 1545 cm− 1 for G-AV2, G-AV3 and G-AV4, respectively. This may be attributed to the interactions between starches and MB. Moreover the absence of absorption at 1718 cm− 1 for C=O instead of –OH appearance at 1637 cm− 1 may indicate the interaction between AV and CS/10/120 in G-AV4 (Fig. 9b).
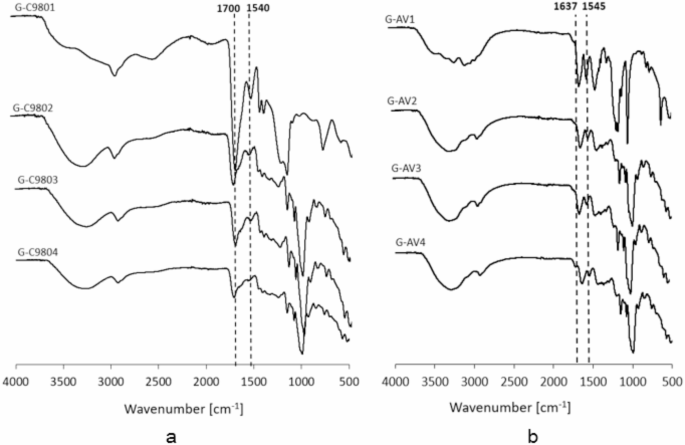
The FTIR spectra exhibited interactions between in C980-based hydrogel (a) and in AV-based hydrogel (b).
Microscopic visualization of starch granules
The morphology of the NS and CS microparticles is shown on Fig. 10.
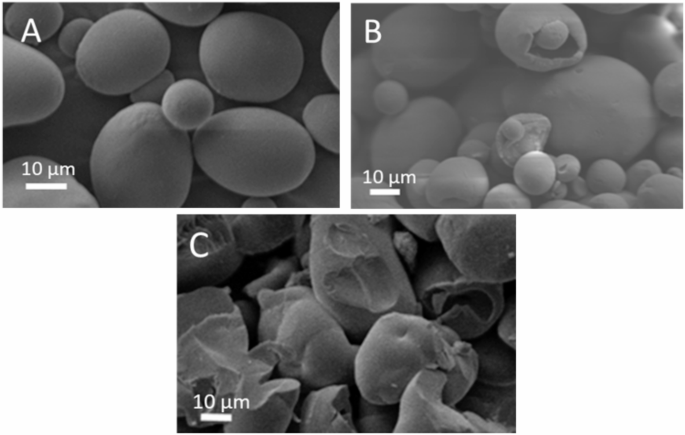
The SEM microphotographs of the following starches: NS (A), CS/2.5/120 (B), CS/10/120 (C). The SEM images submit the structures of native starch (NS) (Fig. 10A), citrate-modified starches with 2.5 g (Fig. 10B) and 10 g (Fig. 10C) of citric acid per 100 g of dry native starch (CS/2.5/120 and CS/10/120, respectively). Both modified starches were subjected to a temperature of 120 °C and annealing at a temperature 2 °C below the phase transition temperature. The images reveal the diverse structures of the starch granules, which are a result of their method of preparation. These structures are compared to those of native starch. In contrast to native starch, which consists of spherical and ellipsoidal structures with smooth surfaces, the low-modified starch (CS/2.5/120) showed indentations and surface defects at the apex of its ellipsoidal structure. The high-modified starch (CS/10/120) exhibited a more irregular structure with numerous depressions and surface defects.
As a result of starch hydrolysis, amylose and amylopectin are broken down through the cleavage of α-(1–4) and α-(1–6) glycosidic linkages, respectively. This process leads to the formation of smaller units such as maltose, glucose, and oligosaccharides. Starch hydrolysis can occur under the influence of water and high temperature (above 100 °C), especially in the presence of acids or enzymes56. In the case of starch esterification, hydrolysis of citric acid occurred, as illustrated in the synthesis scheme of citrated starch (Fig. 3), rather than hydrolysis of the starch itself. The starch esterification process itself was carried out at room temperature. The phenomenon that could have led to the deformation of the starch structure was the following process—thermolysis. Under the influence of high temperatures (typically above 150–160 °C), starch undergoes thermal denaturation. The starch molecules lose their ordered crystalline structure and may undergo dehydration, carbohydrate degradation, and the formation of volatile products such as water and gases. High temperature also induces the transition of starch from its crystalline form to an amorphous state. These observations were made by O. Shulga et al. in their study of eight types of starch, including potato starch57. The analysis was based on thermogravimetric (TG) measurements. It was found that during the thermolysis of potato starch at temperatures ranging from 110 to 320 °C, dehydration of the residual bound water occurred. In the work of S. Shulga et al., the physicochemical properties of potato starch esterified with adipic acid chloride were also analyzed, using methods such as TG and X-ray diffraction (XRD)58. Thermolysis of the modified starch structure was observed in the temperature range from 240 to 370 °C. X-ray diffraction analysis revealed a more amorphous structure in the modified starch compared to native starch (with amorphousness increasing from 88 to 95%).
Our previous studies focused on the adsorption of methylene blue (MB) on selected modified starches, including citrated starch esterified with 10 g of citric acid per 100 g of dry native starch, which was subjected to roasting at 100 °C38. We analyzed the starch structure using thermal methods (DSC) and powder X-ray diffraction (PXRD). The DSC thermograms revealed an endothermic peak at 215 °C, indicative of the thermolysis of citrated starch. PXRD studies showed an increase in the amorphous structure content, from 86% for native starch to 97% for citrated starch.
Elevated temperature during starch thermolysis process results in the destruction of weak hydrogen bonds formed between the hydroxyl groups in glucose molecules. The presence of esterified citric acid groups might have mitigated this process. SEM images revealed significant pores in the granules of low-substituted starch (CS/2.5/120) (Fig. 10B). In the case of highly substituted starch (CS/10/120) (Fig. 10C), the pores were reduced, and the granule structures were more degraded compared to CS/2.5/120. A toroidal aspect, as collapsing the top of the starch granule was observed in citrate tapioca starch, especially for the starches heated at 120 °C with esterification with 30 and 50 g citric acid59.
1 Comment
sx3pfm