Data can also be represented in a circle. This method, to represent data, is called a pie chart.
Let us understand this method with the help of an example.
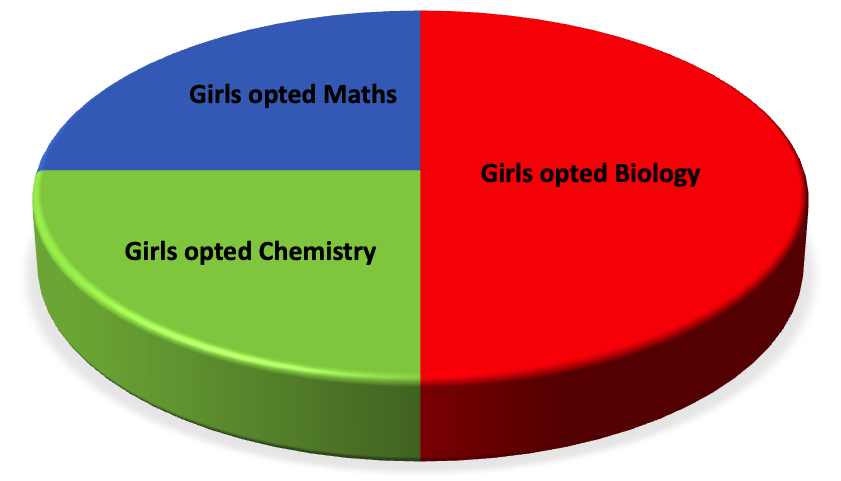
1. There are 60 girls in a class. 30 girls opted Biology, 15 Chemistry and 15 Maths. Represent data in the form of a pie chart.
Solution:
First we find the different fractions of the total numbers of girls for representing girls opted different subjects.
(i) Fraction for girls opted Biology
= \(\frac{\textrm{Number of girls opted Biology}}{\textrm{Total number of girls}}\)
= \(\frac{30}{60}\)
= \(\frac{1}{2}\)
(ii) Fraction for girls opted Chemistry
= \(\frac{\textrm{Number of girls opted Chemistry}}{\textrm{Total number of girls}}\)
= \(\frac{15}{60}\)
= \(\frac{1}{4}\)
(iii) Fraction for girls opted Maths
= \(\frac{\textrm{Number of girls opted Maths}}{\textrm{Total number of girls}}\)
= \(\frac{15}{60}\)
= \(\frac{1}{4}\)

Now we form a circle and represent these fractions in different shades as shown in the above circle. This is the required pie chart.
Remember, bar graphs, frequency charts and pie charts can easily be interpreted to collect various information.

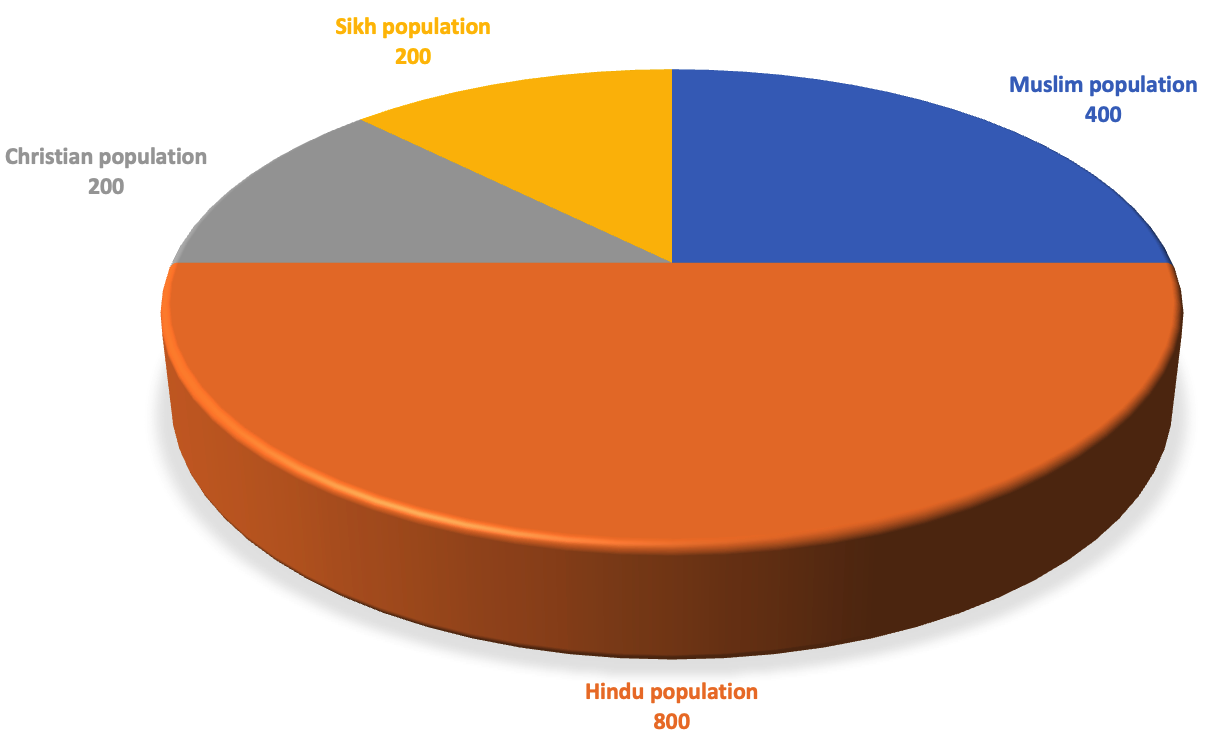
For example, this pie chart (population in a village) gives us the following information.
(i) Hindus are in the majority in the village.
(ii) Christians and Sikhs are in the minority and equal in number in the village.
(iii) Total population of the village is 1600.
(iv) Muslims are less than Hindus but more than Sikhs and Christians.
5th Grade Math Problems
From 5th Grade Pie Chart to HOME PAGE
Didn’t find what you were looking for? Or want to know more information
about Math Only Math.
Use this Google Search to find what you need.


2 Comments
i4tzvj
j6vrew